Algebra
Textbooks
Boundless Algebra
Systems of Equations
Systems of Inequalities and Linear Programming
Algebra Textbooks Boundless Algebra Systems of Equations Systems of Inequalities and Linear Programming
Algebra Textbooks Boundless Algebra Systems of Equations
Algebra Textbooks Boundless Algebra
Algebra Textbooks
Algebra
Concept Version 11
Created by Boundless

Graphs of Linear Inequalities

Graphing linear inequalities involves graphing the original line, and then shading in the area connected to the inequality.

Learning Objective

  • Use graphs to find the solutions of linear inequalities


Key Points

    • To graph a single linear inequality, first graph the inequality as if it were an equation. If the sign is ≤ or ≥, graph a normal line. If it is > or <, then use a dotted or dashed line. Then, shade either above or below the line, depending on if $y$ is greater or less than $mx+b$.
    • If there are multiple linear inequalities, then where the shaded areas of each inequality overlap are the solutions to the system.
    • If the shaded areas of all inequalities in a system do not overlap, then the system has no solution.

Terms

  • inequality

    A statement that of two quantities one is specifically less than or greater than another. Symbols: $<$ or $\leq$ or $>$ or $\geq$, as appropriate.

  • linear

    Of or relating to a class of polynomial of the form $y=ax+b$.


Full Text

Single Inequalities in Two Variables

The simplest inequality to graph is a single inequality in two variables, usually of the form: $y\leq mx+b$, where the inequality can be of any type, less than, less than or equal to, greater than, greater than or equal to, or not equal to. 

Graphing an inequality is easy. First, graph the inequality as if it were an equation. Remember that the solutions to an equation in slope-intercept form are all ordered pairs that satisfy the equation, or make the statement true.  Therefore, if an inequality in two variables has an $=$ symbol, then its line too would be solid.   If the sign is $\leq$ or $\geq$, graph a normal solid line.  If it is $>$ or $<$, then use a dotted or dashed line, since ordered pairs found on the line would result in a false statement.  

Second, shade either above or below the line, depending on if $y$ is greater or less than $mx+b$.  Shading indicates all the ordered pairs in the region that satisfy the inequality.  For example, if the ordered pair is in the shaded region, then that ordered pair makes the inequality a true statement.

Graph a Single Linear Inequality in Two Variables

Example: Sketch the graph of $y\leq x+2$

Since the equation is less than or equal to, start off by drawing the line
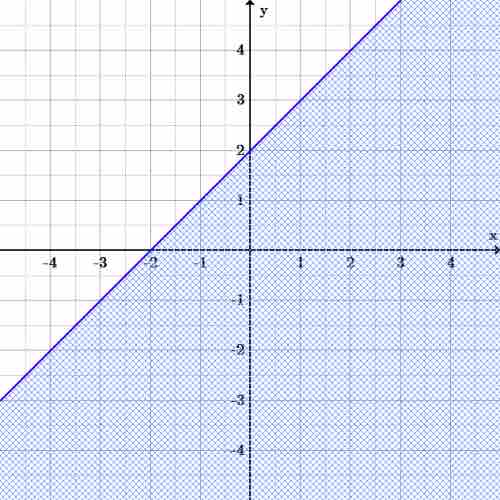
 $y=x+2$, using a solid line.  Next, note that $y$ is less than or equal to $x+2$, which means that $y$ can take on the values along the line ("or equal to"), or any values below the line ("less than"), and so we shade in all the values under the line to get the following graph below.

Inequality graph

Graph of $y\leq x+2$.  All possible solutions are shaded, including the ordered pairs on the line, since the inequality is $\leq$ the line is solid.  There are no solutions above the line.

How to Graph Multiple Linear Inequalities in Two Variables

Now if there is more than one inequality, start off by graphing them one at a time, just as was done with a single inequality. To find solutions for the group of inequalities, observe where the area of all of the inequalities overlap. These overlaps of the shaded regions indicate all solutions (ordered pairs) to the system. This also means that if there are inequalities that don't overlap, then there is no solution to the system.

Example: Sketch the graph of $y<-\frac{1}{2}x+1$ and $y\geq x-2$

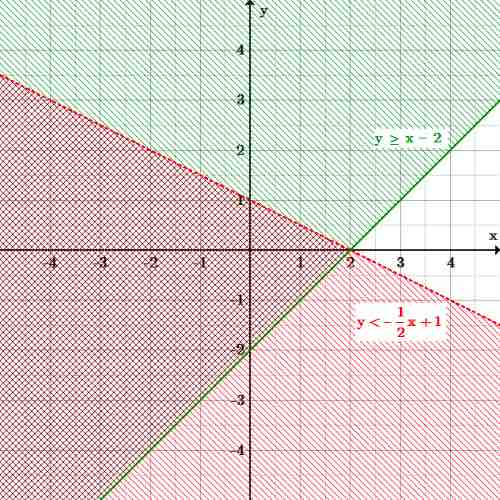
Graph of two inequalities

The overlapping shaded area is the final solution to the system of linear inequalities because it is comprised of all possible solutions to $y<-\frac{1}{2}x+1$ (the dotted red line and red area below the line) and $y\geq x-2$ (the solid green line and the green area above the line).  The origin is a solution to the system, but the point $(3,0)$ is not.  

[ edit ]
Edit this content
Prev Concept
Inconsistent and Dependent Systems in Three Variables
Solving Systems of Linear Inequalities
Next Concept
Subjects
  • Accounting
  • Algebra
  • Art History
  • Biology
  • Business
  • Calculus
  • Chemistry
  • Communications
  • Economics
  • Finance
  • Management
  • Marketing
  • Microbiology
  • Physics
  • Physiology
  • Political Science
  • Psychology
  • Sociology
  • Statistics
  • U.S. History
  • World History
  • Writing

Except where noted, content and user contributions on this site are licensed under CC BY-SA 4.0 with attribution required.