Algebra
Textbooks
Boundless Algebra
Systems of Equations
Systems of Equations in Two Variables
Algebra Textbooks Boundless Algebra Systems of Equations Systems of Equations in Two Variables
Algebra Textbooks Boundless Algebra Systems of Equations
Algebra Textbooks Boundless Algebra
Algebra Textbooks
Algebra
Concept Version 13
Created by Boundless

Solving Systems Graphically

A simple way to solve a system of equations is to look for the intersecting point or points of the equations. This is the graphical method.

Learning Objective

  • Solve a system of equations in two variables graphically


Key Points

    • To solve a system of equations graphically, graph the equations and identify the points of intersection as the solutions. There can be more than one solution to a system of equations.
    • A system of linear equations will have one point of intersection, or one solution.
    • To graph a system of equations that are written in standard form, you must rewrite the equations in slope-intercept form.

Terms

  • system of equations

    A set of equations with multiple variables which can be solved using a specific set of values.

  • The graphical method

    A way of visually finding a set of values that solves a system of equations.


Full Text

A system of equations (also known as simultaneous equations) is a set of equations with multiple variables, solved when the values of all variables simultaneously satisfy all of the equations. The most common ways to solve a system of equations are:

  • The elimination method
  • The substitution method
  • The graphical method

Here, we will address the graphical method.

Solving Systems Graphically

Some systems have only one set of correct answers, while others have multiple sets that will satisfy all equations. Shown graphically, a set of equations solved with only one set of answers will have only have one point of intersection, as shown below. This point is considered to be the solution of the system of equations. In a set of linear equations (such as in the image below), there is only one solution.

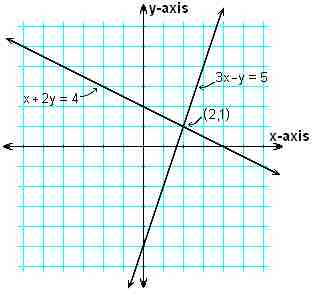
System of linear equations with two variables

This graph shows a system of equations with two variables and only one set of answers that satisfies both equations.

A system with two sets of answers that will satisfy both equations has two points of intersection (thus, two solutions of the system), as shown in the image below.

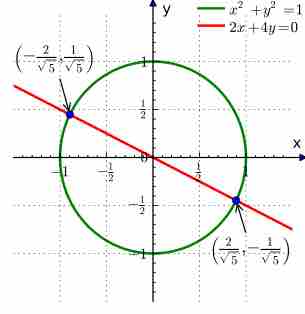
System of equations with multiple answers

This is an example of a system of equations shown graphically that has two sets of answers that will satisfy both equations in the system.

Converting to Slope-Intercept Form

Before successfully solving a system graphically, one must understand how to graph equations written in standard form, or $Ax+By=C$. You can always use a graphing calculator to represent the equations graphically, but it is useful to know how to represent such equations formulaically on your own.

To do this, you need to convert the equations to slope-intercept form, or $y=mx+b$, where m = slope and b = y-intercept. 

The best way to convert an equation to slope-intercept form is to first isolate the y variable and then divide the right side by B, as shown below.

 $\begin{aligned} \displaystyle Ax+By&=C \\By&=-Ax+C \\y&=\frac{-Ax+C}{B} \\y&=-\frac{A}{B}x+\frac{C}{B} \end{aligned}$

Now $\displaystyle -\frac{A}{B}$ is the slope m, and $\displaystyle \frac{C}{B}$ is the y-intercept b. 

Identifying Solutions on a Graph

Once you have converted the equations into slope-intercept form, you can graph the equations. To determine the solutions of the set of equations, identify the points of intersection between the graphed equations. The ordered pair that represents the intersection(s) represents the solution(s) to the system of equations.

[ edit ]
Edit this content
Prev Concept
Introduction to Systems of Equations
The Substitution Method
Next Concept
Subjects
  • Accounting
  • Algebra
  • Art History
  • Biology
  • Business
  • Calculus
  • Chemistry
  • Communications
  • Economics
  • Finance
  • Management
  • Marketing
  • Microbiology
  • Physics
  • Physiology
  • Political Science
  • Psychology
  • Sociology
  • Statistics
  • U.S. History
  • World History
  • Writing

Except where noted, content and user contributions on this site are licensed under CC BY-SA 4.0 with attribution required.