Algebra
Textbooks
Boundless Algebra
Linear Functions
Applications of Linear Functions
Algebra Textbooks Boundless Algebra Linear Functions Applications of Linear Functions
Algebra Textbooks Boundless Algebra Linear Functions
Algebra Textbooks Boundless Algebra
Algebra Textbooks
Algebra
Concept Version 11
Created by Boundless

Rates of Change

Linear functions apply to real world problems that involve a constant rate.

Learning Objective

  • Apply linear equations to solve problems about rates of change


Key Points

    • If you know a real-world problem is linear, such as the distance you travel when you go for a jog, you can graph the function and make some assumptions with only two points.
    • The slope of a function is the same as the rate of change for the dependent variable $(y)$. For instance, if you're graphing distance vs. time, then the slope is how fast your distance is changing with time, or in other words, your velocity.

Terms

  • slope

    The ratio of the vertical and horizontal distances between two points on a line; zero if the line is horizontal, undefined if it is vertical.

  • rate of change

    Ratio between two related quantities that are changing.

  • linear equation

    A polynomial equation of the first degree (such as $x=2y-7$).


Full Text

Rate of Change

Linear equations often include a rate of change.  For example, the rate at which distance changes over time is called velocity.  If two points in time and the total distance traveled is known the rate of change, also known as slope, can be determined.  From this information, a linear equation can be written and then predictions can be made from the equation of the line.  

If the unit or quantity in respect to which something is changing is not specified, usually the rate is per unit of time. The most common type of rate is "per unit of time", such as speed, heart rate and flux. Ratios that have a non-time denominator include exchange rates, literacy rates, and electric field (in volts/meter).

In describing the units of a rate, the word "per" is used to separate the units of the two measurements used to calculate the rate (for example a heart rate is expressed "beats per minute").

Rate of Change: Real World Application

Example 

An athlete begins he normal practice for the next marathon during the evening. At 6:00 pm he starts to run and leaves his home.  At 7:30 pm, the athlete finishes the run at home and has run a total of 7.5 miles. How fast was his average speed over the course of the run?

The rate of change is the speed of his run; distance over time. Therefore, the two variables are time $(x)$ and distance $(y)$. The first point is at his house, where his watch read 6:00 pm. This is the beginning time so let's set it to $0$.  So our first point is $(0,0)$ because he did not run anywhere yet. Let's think about our time in hours.  Our second point is $1.5$ hours later, and we ran $7.5$ miles. The second point is $(1.5,7.5)$. Our speed (rate of change) is simply the slope of the line connecting the two points. The slope, given by: $m = \frac{y_{2}-y_{1}}{x_{2}-x_{1}}$ becomes $m = \frac{7.5}{1.5}=5 $ miles per hour.

Example:  Graph the line illustrating speed

To graph this line, we need the $y$-intercept and the slope to write the equation. The slope was $5$ miles per hour and since the starting point was at $(0,0)$, the $y$-intercept is $0$. So our final function is $y=5x$.

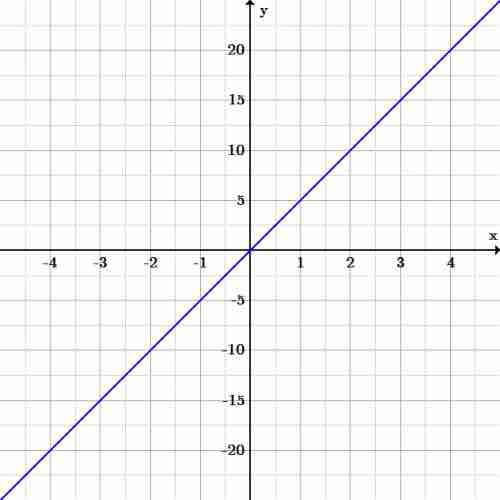
Distance and time graph

The graph of $y=5x$. The two variables are time $(x)$ and distance $(y)$.  The rate the runner runs is $5$ miles per hour.  Using the graph, predictions can be made assuming that his average speed remains the same.

With this new function, we can now answer some more questions.

  • How many miles did he run after the first half hour?  Using the equation, if $x=\frac{1}{2}$, solve for $y$.  If $y=5x$, then $y=5(0.5)=2.5$ miles.
  • If he kept running at the same pace for a total of $3$ hours, how many miles will he have run? If $x=3$, solve for $y$.  If $y=5x$, then $y=5(3)=15$ miles. 

There are many such applications for linear equations. Anything that involves a constant rate of change can be nicely represented with a line with the slope. Indeed, so long as you have just two points, if you know the function is linear, you can graph it and begin asking questions! Just make sure what you're asking and graphing makes sense. For instance, in the marathon example, the domain is really only $x\geq0$, since it doesn't make sense to go into negative time and lose miles!

[ edit ]
Edit this content
Prev Concept
Linear Inequalities
Linear Mathematical Models
Next Concept
Subjects
  • Accounting
  • Algebra
  • Art History
  • Biology
  • Business
  • Calculus
  • Chemistry
  • Communications
  • Economics
  • Finance
  • Management
  • Marketing
  • Microbiology
  • Physics
  • Physiology
  • Political Science
  • Psychology
  • Sociology
  • Statistics
  • U.S. History
  • World History
  • Writing

Except where noted, content and user contributions on this site are licensed under CC BY-SA 4.0 with attribution required.