Algebra
Textbooks
Boundless Algebra
Exponents, Logarithms, and Inverse Functions
Graphs of Exponential and Logarithmic Functions
Algebra Textbooks Boundless Algebra Exponents, Logarithms, and Inverse Functions Graphs of Exponential and Logarithmic Functions
Algebra Textbooks Boundless Algebra Exponents, Logarithms, and Inverse Functions
Algebra Textbooks Boundless Algebra
Algebra Textbooks
Algebra
Concept Version 13
Created by Boundless

Basics of Graphing Exponential Functions

The exponential function $y=b^x$ where $b>0$ is a function that will remain proportional to its original value when it grows or decays.

Learning Objective

  • Describe the properties of graphs of exponential functions


Key Points

    • If the base, $b$, is greater than $1$, then the function increases exponentially at a growth rate of $b$. This is known as exponential growth.
    • If the base, $b$, is less than $1$ (but greater than $0$) the function decreases exponentially at a rate of $b$. This is known as exponential decay.
    • If the base, $b$, is equal to $1$, then the function trivially becomes $y=a$ .
    • The points $(0,1)$ and $(1,b)$ are always on the graph of the function $y=b^x$
    • The function $y=b^x$ takes on only positive values and has the $x$-axis as a horizontal asymptote.

Terms

  • exponential growth

    The growth in the value of a quantity, in which the rate of growth is proportional to the instantaneous value of the quantity; for example, when the value has doubled, the rate of increase will also have doubled. The rate may be positive or negative. If negative, it is also known as exponential decay.

  • exponential function

    Any function in which an independent variable is in the form of an exponent; they are the inverse functions of logarithms.

  • asymptote

    A line that a curve approaches arbitrarily closely. An asymptote may be vertical, oblique or horizontal. Horizontal asymptotes correspond to the value the curve approaches as $x$ gets very large or very small.


Full Text

Definitions

At the most basic level, an exponential function is a function in which the variable appears in the exponent. The most basic exponential function is a function of the form $y=b^x$ where $b$ is a positive number.

When $b>1$ the function grows in a manner that is proportional to its original value. This is called exponential growth. 

When $0>b>1$ the function decays in a manner that is proportional to its original value. This is called exponential decay.

Graphing an Exponential Function

Example 1

Let us consider the function $y=2^x$ when $b>1​$. One way to graph this function is to choose values for $x$ and substitute these into the equation to generate values for $y$. Doing so we may obtain the following points:

$(-2,\frac{1}{4})$, $(-1,\frac{1}{2})$, $(0,1)$, $(1,2)$ and $(2,4)$

As you connect the points, you will notice a smooth curve that crosses the
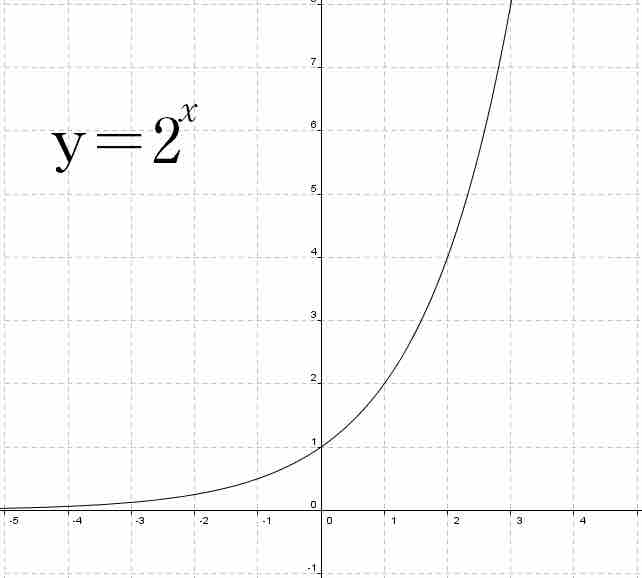
 $y$-axis at the point $(0,1)$ and is increasing as $x$ takes on larger and larger values. That is, the curve approaches infinity as $x$ approaches infinity. As $x$ takes on smaller and smaller values the curve gets closer and closer to the $x$-axis. That is, the curve approaches zero as $x$ approaches negative infinity making the $x$-axis is a horizontal asymptote of the function. The point $(1,b)$ is on the graph. This is true of the graph of all exponential functions of the form $y=b^x$ for $x>1$.

Graph of $y=2^x$

The graph of this function crosses the $y$-axis at $(0,1)$ and increases as $x$ approaches infinity. The $x$-axis is a horizontal asymptote of the function.

Example 2

Let us consider the function $y=\frac{1}{2}^x$ when $0<b<1$. One way to graph this function is to choose values for $x$ and substitute these into the equation to generate values for $y$. Doing so you can obtain the following points:

$(-2,4)$, $(-1,2)$, $(0,1)$, $(1,\frac{1}{2})$ and $(2,\frac{1}{4})$

As you connect the points you will notice a smooth curve that crosses the y-axis at the point $(0,1)$ and is decreasing as $x$ takes on larger and larger values. The curve approaches infinity zero as approaches infinity. As $x$ takes on smaller and smaller values the curve gets closer and closer to the $x$ -axis. That is, the curve approaches zero as $x$ approaches negative infinity making the $x$-axis a horizontal asymptote of the function. The point $(1,b)$ is on the graph. This is true of the graph of all exponential functions of the form $y=b^x$ for $0<x<1$.

As you can see in the graph below, the graph of $y=\frac{1}{2}^x$ is symmetric to that of $y=2^x$ over the $y$-axis. That is, if the plane were folded over the $y$-axis, the two curves would lie on each other. 

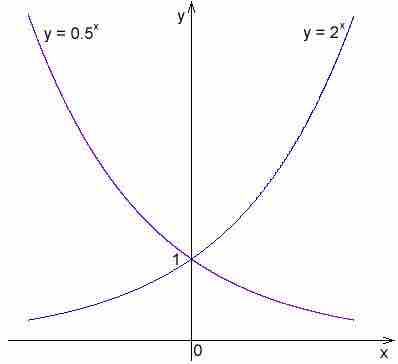
Graph of $y=2^x$ and $y=\frac{1}{2}^x$

The graphs of these functions are symmetric over the $y$-axis.

Why Must $b$ Be a Positive Number?

If $b=1$, then the function becomes $y=1^x$. As $1$ to any power yields $1$, the function is equivalent to $y=1$ which is a horizontal line, not an exponential equation.

If $b$ is negative, then raising $b$ to an even power results in a positive value for $y$ while raising $b$ to an odd power results in a negative value for $y$, making it impossible to join the points obtained an any meaningful way and certainly not in a way that generates a curve as those in the examples above.

Properties of Exponential Graphs

The point $(0,1)$ is always on the graph of an exponential function of the form $y=b^x$ because $b$ is positive and any positive number to the zero power yields $1$.

The point $(1,b)$ is always on the graph of an exponential function of the form $y=b^x$ because any positive number $b$ raised to the first power yields $1$.

The function $y=b^x$ takes on only positive values because any positive number $b$ will yield only positive values when raised to any power.

The function $y=b^x$ has the $x$-axis as a horizontal asymptote because the curve will always approach the $x$-axis as $x$ approaches either positive or negative infinity, but will never cross the axis as it will never be equal to zero.

[ edit ]
Edit this content
Prev Concept
Converting between Exponential and Logarithmic Equations
Graphs of Logarithmic Functions
Next Concept
Subjects
  • Accounting
  • Algebra
  • Art History
  • Biology
  • Business
  • Calculus
  • Chemistry
  • Communications
  • Economics
  • Finance
  • Management
  • Marketing
  • Microbiology
  • Physics
  • Physiology
  • Political Science
  • Psychology
  • Sociology
  • Statistics
  • U.S. History
  • World History
  • Writing

Except where noted, content and user contributions on this site are licensed under CC BY-SA 4.0 with attribution required.