

PowerPoint 2013
Charts
Inserting charts
PowerPoint uses a spreadsheet as a placeholder for entering chart data, much like Excel. The process of entering data is fairly simple, but if you are unfamiliar with Excel you might want to review our Excel 2013 Cell Basics lesson.
To insert a chart:
- Select the Insert tab, then click the Chart command in the Illustrations group.
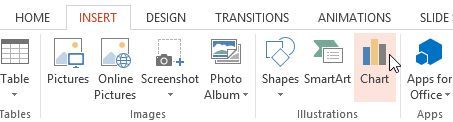 Clicking the Chart command
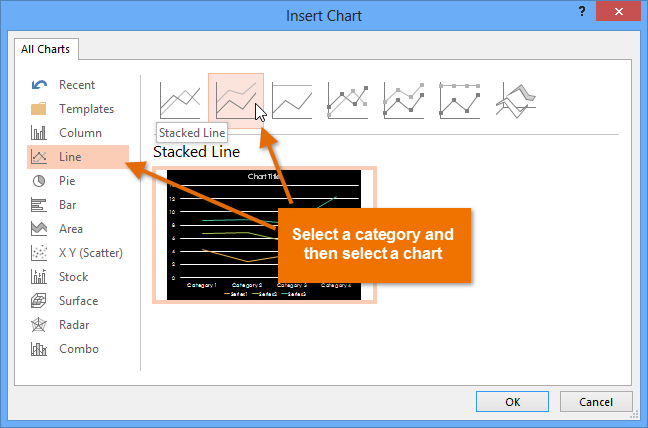
 - A dialog box will appear. Select a category from the left pane, and review the charts that appear in the right pane.
- Select the desired chart, then click OK.
 Choosing a chart type
 - A chart and a spreadsheet will appear. The data that appears in the spreadsheet is placeholder source data you will replace with your own information. The source data is used to create the chart.
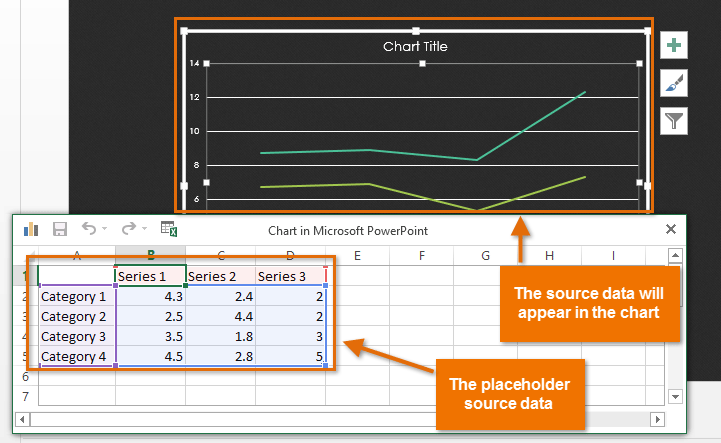 The placeholder source data and the corresponding chart
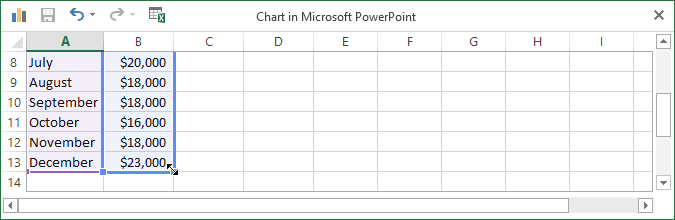
 - Enter data into the worksheet.
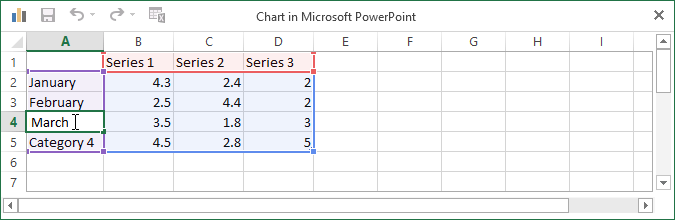 Entering data into the worksheet
 - If necessary, click and drag the lower-right corner of the blue line to increase or decrease the data range for rows and columns. Only the data enclosed by the blue lines will appear in the chart.
 Dragging the blue line to decrease the data range
 - When you're done, click the X to close the spreadsheet.
 Closing the worksheet
 - The chart will be completed.
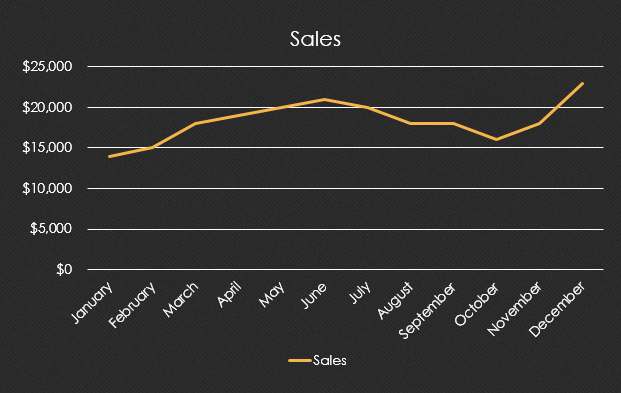 The completed chart
You can edit the chart data at any time by selecting your chart and clicking the Edit Data command on the Design tab.
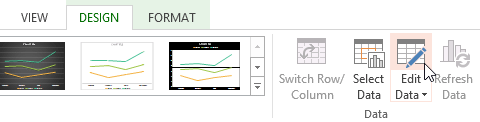 Clicking the Edit Data command
You can also click the Insert Chart command in a placeholder to insert a new chart.
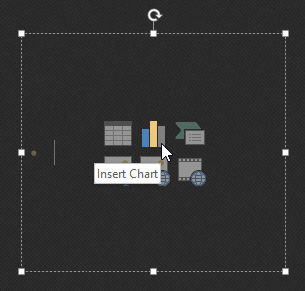 Insering a chart from a placeholder
Creating charts with existing Excel data
If you already have data in an existing Excel file that you would like to use for a chart, you can transfer the data by copying and pasting it. Just open the spreadsheet in Excel, select and copy the desired data, and paste it into the source data area for your chart.
You can also embed an existing Excel chart into your PowerPoint presentation. This may be useful when you know you'll need to update the data in your Excel file and would like the chart to automatically update whenever the Excel data is changed.
Read our guide on Embedding an Excel Chart for more information.


