

Excel 2003
Formatting a Chart
Changing the data series color
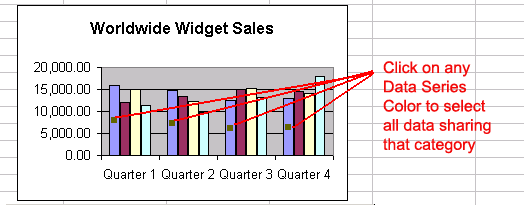
When a chart is created in Excel 2003, you'll notice that color is automatically applied to the data series. You can keep this format or change it for each data series in the chart. Many different aspects of each data series can be changed, but you'll probably change the color of bars, columns, pie slices, and areas most often.
To change the color of a data series:
- Select the data series you wish to edit.
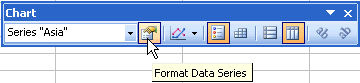
- Click the Format button on the Chart toolbar (or double-click the data series).
- Use the Format Data Series dialog box to pick a new color.
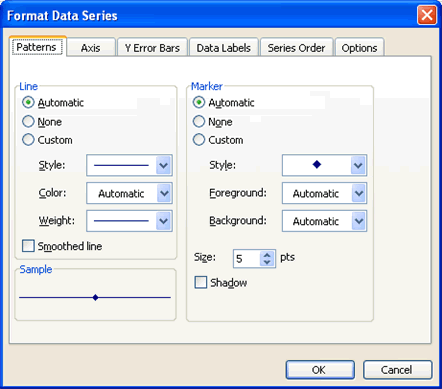
- Click the OK button to accept the Data Series color changes.


