

Report to Congress on Traumatic Brain Injury in the United States: Understanding the Public Health Problem among Current and Former Military Personnel
 ShareCompartir
Detailed Data Tables
The map below of the VHA Polytrauma/TBI System of Care FY 2013 is located on PDF page 42, document page 25. The data in the map is described in the table below.
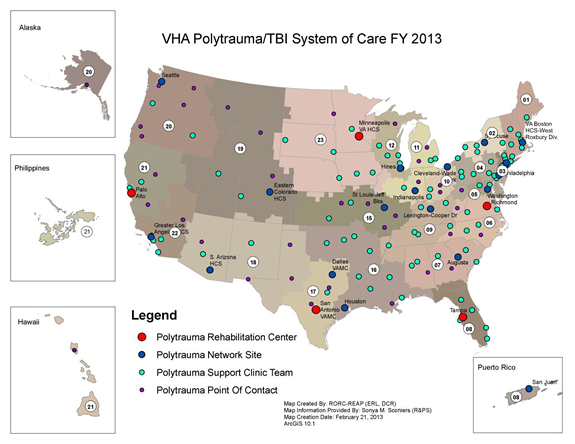
| VISN: Veterans Integrated Service Network | Station # | FACILITY | PRC: Polytrauma Rehabilitation Center | PNS: Polytrauma Network Site | PSCT: Polytrauma Support Clinic Team | PPOC: Polytrauma Point of Contact |
|---|---|---|---|---|---|---|
| 1 | 402 | Togus | x | |||
| 405 | White River Jct | x | ||||
| 518 | Bedford | x | ||||
| 523A4 | VA Boston HCS-West Roxbury Div. | x | ||||
| 608 | Manchester | x | ||||
| 631 | Northampton | x | ||||
| 650 | Providence | x | ||||
| 689 | West Haven | x | ||||
| 2 | 528 | Western New York HCS - Buffalo | x | |||
| 528A5 | Canandaigua | x | ||||
| 528A6 | Bath | x | ||||
| 528A7 | Syracuse | x | ||||
| 528A8 | Albany | x | ||||
| 3 | 526 | Bronx | x | |||
| 561 | New Jersey HCS | x | ||||
| 561A4 | Lyons | x | ||||
| 620 | Hudson Valley HCS | x | ||||
| 620A4 | Castle Point Division-Hudson Valley HCS | x | ||||
| 630 | New York Harbor HCS - NY Div. | x | ||||
| 630A4 | New York Harbor HCS-Brooklyn | x | ||||
| 630A5 | New York Harbor HCS-St. Albans | x | ||||
| 632 | Northport | x | ||||
| 4 | 460 | Wilmington | x | |||
| 503 | James E. Van Zandt VA(Altoona) | x | ||||
| 529 | Butler | x | ||||
| 540 | Clarksburg | x | ||||
| 542 | Coatesville | x | ||||
| 562 | Erie | x | ||||
| 595 | Lebanon | x | ||||
| 642 | Philadelphia | x | ||||
| 646 | Pittsburgh HCS-Univ Dr | x | ||||
| 693 | Wilkes Barre | x | ||||
| 5 | 512 | Baltimore | x | |||
| 613 | Martinsburg | x | ||||
| 688 | Washington | x | ||||
| 6 | 517 | Beckley | x | |||
| 558 | Durham | x | ||||
| 565 | Fayetteville NC | x | ||||
| 590 | Hampton | x | ||||
| 637 | Asheville-Oteen | x | ||||
| 652 | Richmond | x | x | |||
| 658 | Salem | x | ||||
| 659 | W.G. (Bill) Hefner Salisbury VAMC | x | ||||
| 7 | 508 | Atlanta | x | |||
| 509 | Augusta | x | ||||
| 521 | Birmingham | x | ||||
| 534 | Charleston | x | ||||
| 544 | Columbia SC | x | ||||
| 557 | Dublin | x | ||||
| 619A4 | Tuskegee | x | ||||
| 679 | Tuscaloosa | x | ||||
| 8 | 516 | Bay Pines | x | |||
| 546 | Miami | x | ||||
| 548 | W Palm Beach | x | ||||
| 573 | North Florida/South Georgia HCS-Gainesville | x | ||||
| 672 | San Juan | x | ||||
| 673 | Tampa | x | x | |||
| 675 | Orlando | x | ||||
| 9 | 581 | Huntington | x | |||
| 596A4 | Lexington-Cooper Dr | x | ||||
| 603 | Louisville | x | ||||
| 614 | Memphis | x | ||||
| 621 | Mountain Home | x | ||||
| 626 | Middle Tennessee HCS - Nashville | x | ||||
| 626A4 | Middle Tennessee HCS-Murfreesboro | x | ||||
| 10 | 538 | Chillicothe | x | |||
| 539 | Cincinnati | x | ||||
| 541 | Cleveland-Wade Park | x | ||||
| 552 | Dayton | x | ||||
| 757 | Columbus | x | ||||
| 11 | 506 | Ann Arbor HCS | x | |||
| 515 | Battle Creek | x | ||||
| 550 | Illiana HCS (Danville) | x | ||||
| 553 | Detroit (John D. Dingell) | x | ||||
| 583 | Indianapolis | x | ||||
| 610 | N. Indiana HCS-Marion | x | ||||
| 655 | Saginaw | x | ||||
| 12 | 537 | Jesse Brown VAMC - Chicago HCS | x | |||
| 556 | Capt James A Lovell Fed HCC - North Chicago | x | ||||
| 578 | Hines | x | ||||
| 585 | Iron Mountain MI | x | ||||
| 607 | Madison WI | x | ||||
| 676 | Tomah | x | ||||
| 695 | Milwaukee WI | x | ||||
| 15 | 589 | Kansas City | x | |||
| 589A4 | Columbia MO | x | ||||
| 589A5 | Eastern Kansas HCS - Topeka Division | x | ||||
| 589A7 | Robert J. Dole VAM&ROC (Wichita) | x | ||||
| 657A0 | St Louis-Jeff Bks. | x | ||||
| 657A4 | Poplar Bluff | x | ||||
| 657A5 | Marion IL | x | ||||
| 16 | 502 | Alexandria | x | |||
| 520 | Gulf Coast HCS - Biloxi | x | ||||
| 564 | Fayetteville AR | x | ||||
| 580 | Houston | x | ||||
| 586 | G. V. (Sonny) Montgomery VAMC - Jackson | x | ||||
| 598 | Central AR. Veterans HCS LR | x | ||||
| 623 | Muskogee | x | ||||
| 629 | Southeast Louisiana HCS - New Orleans | x | ||||
| 635 | Oklahoma City | x | ||||
| 667 | Overton Brooks VAMC - Shreveport | x | ||||
| 17 | 549 | Dallas VAMC | x | |||
| 671 | San Antonio VAMC | x | x | |||
| 671A4 | Kerrville VAMC | x | ||||
| 674 | Temple VAMC | x | ||||
| 674A4 | Waco VAMC | x | ||||
| 740 | NVAHC Valley Costal Bend | x | ||||
| 18 | 501 | New Mexico HCS - Albuquerque | x | |||
| 504 | Amarillo HCS | x | ||||
| 519 | West Texas HCS - Big Spring | x | ||||
| 644 | Phoenix | x | ||||
| 649 | Northern Arizona HCS - Prescott | x | ||||
| 678 | S. Arizona HCS - Tucson | x | ||||
| 756 | El Paso | x | ||||
| 19 | 436 | Montana HCS - Ft. Harrison | x | |||
| 442 | Cheyenne | x | ||||
| 554 | Eastern Colorado HCS - Denver | x | ||||
| 575 | Grand Junction | x | ||||
| 660 | Salt Lake City HCS - George E. Wahlen VAMC | x | ||||
| 666 | Sheridan | x | ||||
| 20 | 463 | Anchorage | x | |||
| 531 | Boise | x | ||||
| 648 | Portland | x | ||||
| 653 | Roseburg HCS | x | ||||
| 663 | Seattle | x | ||||
| 663A4 | American Lake | x | ||||
| 668 | Spokane | x | ||||
| 687 | Walla Walla | x | ||||
| 692 | S. Oregon Rehabilitation Center - White City | x | ||||
| 21 | 459 | Pacific Islands HCS (Honolulu) | x | |||
| 570 | Fresno | x | ||||
| 612A4 | N. California HCS-Sacramento | x | ||||
| 640 | Palo Alto-Palo Alto | x | x | |||
| 654 | Sierra Nevada HCS - Reno | x | ||||
| 662 | San Francisco | x | ||||
| 358 | Manila | x | ||||
| 22 | 593 | Southern Nevada HCS - Las Vegas | x | |||
| 600 | Long Beach HCS | x | ||||
| 605 | Loma Linda VAMC | x | ||||
| 664 | San Diego HCS | x | ||||
| 691 | Greater Los Angeles HCS | x | ||||
| 23 | 437 | Fargo VA HCS | x | |||
| 438 | Sioux Falls | x | ||||
| 568 | Black Hills HCS | x | ||||
| 618 | Minneapolis VA HCS | x | x | |||
| 636 | Nebraska-Western Iowa HCS | x | ||||
| 636A6 | Central Iowa | x | ||||
| 636A8 | Iowa City | x | ||||
| 656 | St Cloud | x | ||||
| TOTAL | 5 | 23 | 87 | 39 |
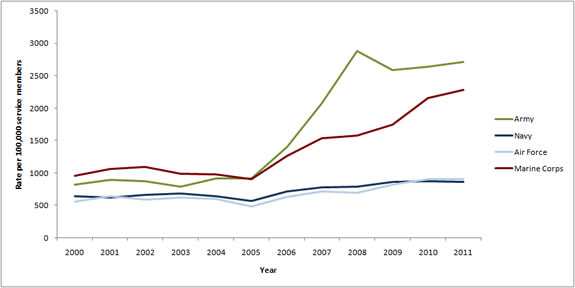
The graph below, Figure 3. Estimated Overall Annual incidence Rates of TBI among Active-Duty U.S. Military Service Members by Service Branch, 2000–2011 is located on PDF page 74, document page 57. The data in the graph is described in the table below.
| Service Branch | Year | |||||||||||
|---|---|---|---|---|---|---|---|---|---|---|---|---|
| 2000 | 2001 | 2002 | 2003 | 2004 | 2005 | 2006 | 2007 | 2008 | 2009 | 2010 | 2011 | |
| Army | 815.61 | 892.11 | 873.39 | 786.12 | 918.89 | 915.96 | 1396.81 | 2070.56 | 2884.88 | 2592.10 | 2642.80 | 2717.85 |
| Navy | 640.22 | 622.03 | 663.32 | 682.28 | 644.73 | 570.90 | 715.16 | 782.20 | 792.82 | 866.64 | 870.83 | 860.56 |
| Air Force | 556.18 | 635.96 | 593.06 | 624.35 | 603.30 | 486.31 | 631.59 | 709.52 | 694.95 | 823.79 | 899.16 | 899.27 |
| Marine Corps | 959.79 | 1059.40 | 1097.20 | 990.52 | 977.29 | 909.14 | 1257.68 | 1530.37 | 1575.99 | 1747.63 | 2155.35 | 2286.27 |

- Page last reviewed: January 22, 2016
- Page last updated: January 22, 2016
- Content source:
- Centers for Disease Control and Prevention,
- National Center for Injury Prevention and Control,
- Division of Unintentional Injury Prevention