

Trends in Current Cigarette Smoking Among High School Students and Adults, United States, 1965–2014
 ShareCompartir
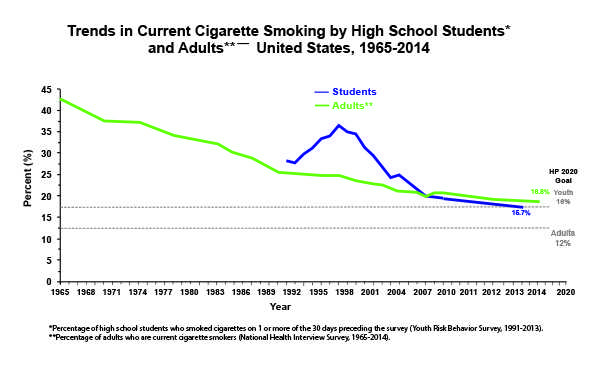
| Students* (%) | Adults** (%) | |
|---|---|---|
| 1965 | 42.4 | |
| 1966 | ||
| 1967 | ||
| 1968 | ||
| 1969 | ||
| 1970 | 37.4 | |
| 1971 | ||
| 1972 | ||
| 1973 | ||
| 1974 | 37.1 | |
| 1975 | ||
| 1976 | ||
| 1977 | ||
| 1978 | 34.1 | |
| 1979 | ||
| 1980 | 33.2 | |
| 1981 | ||
| 1982 | ||
| 1983 | 32.1 | |
| 1984 | ||
| 1985 | 30.1 | |
| 1986 | ||
| 1987 | 28.8 | |
| 1988 | ||
| 1989 | ||
| 1990 | 25.5 | |
| 1991 | 27.5 | |
| 1992 | ||
| 1993 | 30.5 | 25 |
| 1994 | ||
| 1995 | 34.8 | 24.7 |
| 1996 | ||
| 1997 | 36.4 | 24.7 |
| 1998 | ||
| 1999 | 34.8 | 23.5 |
| 2000 | ||
| 2001 | 28.5 | 22.8 |
| 2002 | 22.5 | |
| 2003 | 21.9 | 21.6 |
| 2004 | 20.9 | |
| 2005 | 23 | 20.9 |
| 2006 | 20.8 | |
| 2007 | 20 | 19.8 |
| 2008 | 20.6 | |
| 2009 | 19.5 | 20.6 |
| 2010 | 19.3 | |
| 2011 | 18.1 | 19.0 |
| 2012 | 18.1 | |
| 2013 | 15.7 | 17.8 |
| 2014 | 16.8 | |
| Healthy People 2020 Goals |
16 | 12 |
*Percentage of high school students who smoked cigarettes on 1 or more of the 30 days preceding the survey. Data first collected in 1991. (Youth Risk Behavior Survey, 1991–2013).
**Percentage of adults who are current cigarette smokers (National Health Interview Survey, 1965–2014).
- Page last reviewed: March 30, 2016
- Page last updated: March 30, 2016
- Content source: