

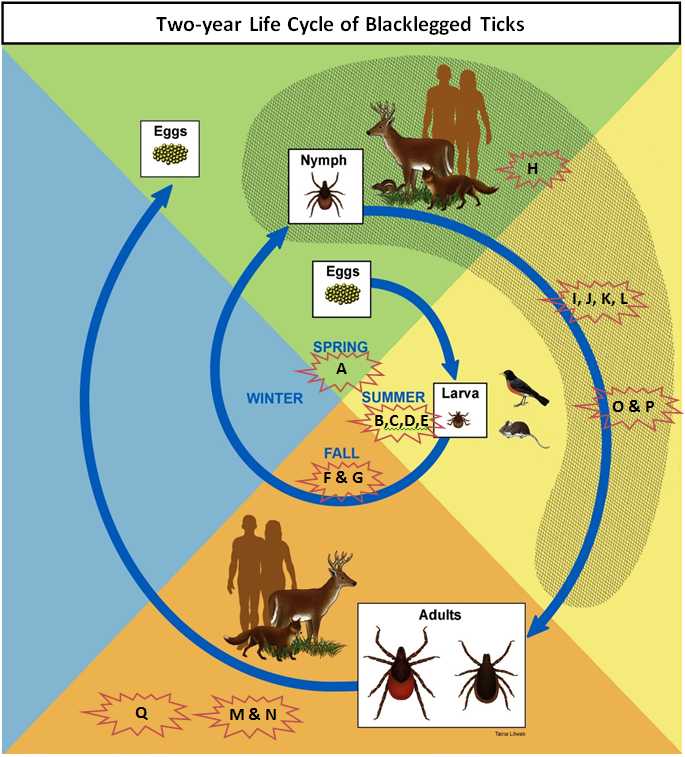
Tick Life Cycle & Study Activity Timeline
 ShareCompartir
| Season | Month and Year | Study Timeline and Actions |
|---|---|---|
| Shaded area on diagram indicates seasons where the risk of contracting tickborne disease is greatest. | ||
| Spring | May 2013 |
A Pest control company schedules bait box placement |
| Summer | June–August, 2013 |
B Activity Log C Ticks collected on selected properties D 1st round bait boxes placed targeting larvae E Survey #1 |
| Fall | October & November, 2013 |
F 1st round bait boxes removed G Survey #2 |
| Spring | May 2014 |
H 2nd round bait boxes placed targeting nymphs |
| Summer | June – August, 2014 |
I Ticks collected on selected properties J Survey #3 K 2nd round bait boxes removed L 3rd round bait boxes blaced targeting larvae |
| Fall | October & November, 2014 |
M 3rd round bait boxes removed N Survey #4 |
| Summer | June-August, 2015 |
O Ticks collected on selected properties P Survey #5 |
| Fall | November 2015 |
Q Survey #6 |
- Page last reviewed: December 2, 2015
- Page last updated: December 2, 2015
- Content source: