


OCCUPATIONAL HEARING LOSS (OHL) SURVEILLANCE
 ShareCompartir
Wholesale and Retail Trade (WRT) Statistics
Noise Exposure and Hearing Protection
- About 14% of all workers in Wholesale Trade and 10% of all workers in Retail Trade are exposed to hazardous noise.1
- 47% of noise-exposed Wholesale Trade workers and 52% of noise-exposed Retail Trade workers report not wearing hearing protection.1
Hearing Loss and Tinnitus
- Approximately 12% of all Wholesale Trade workers and 10% of all Retail Trade workers have hearing difficulty.2
- About 6% of all Wholesale Trade workers and 7% of all Retail Trade workers have tinnitus.2
- About 20% of noise-exposed tested WRT workers have a material hearing impairment. Hearing impairment is hearing loss that impacts day-to-day activities.3
- 13% of noise-exposed tested WRT workers have hearing impairment in both ears.4
Trends Among Noise-Exposed Tested WRT Workers (1980-2010)3
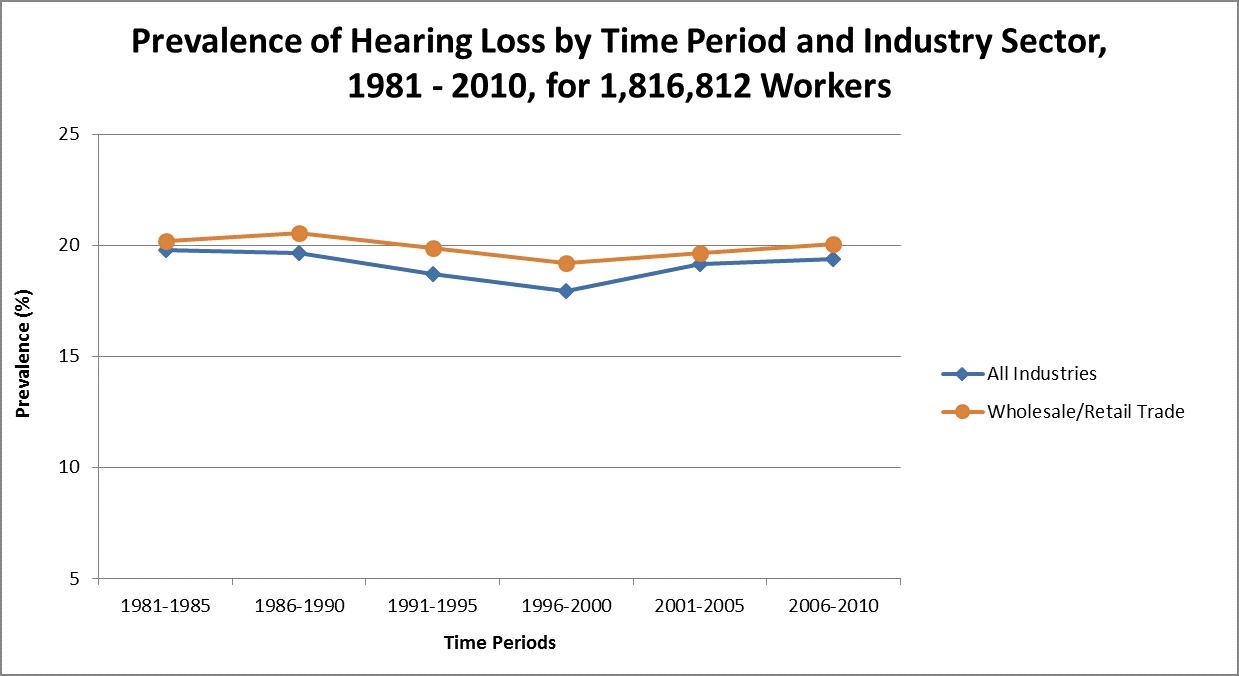
- The prevalence for WRT decreased less than 1% over 30 years (1981-2010) as compared with a less than 1% reduction for all industries.
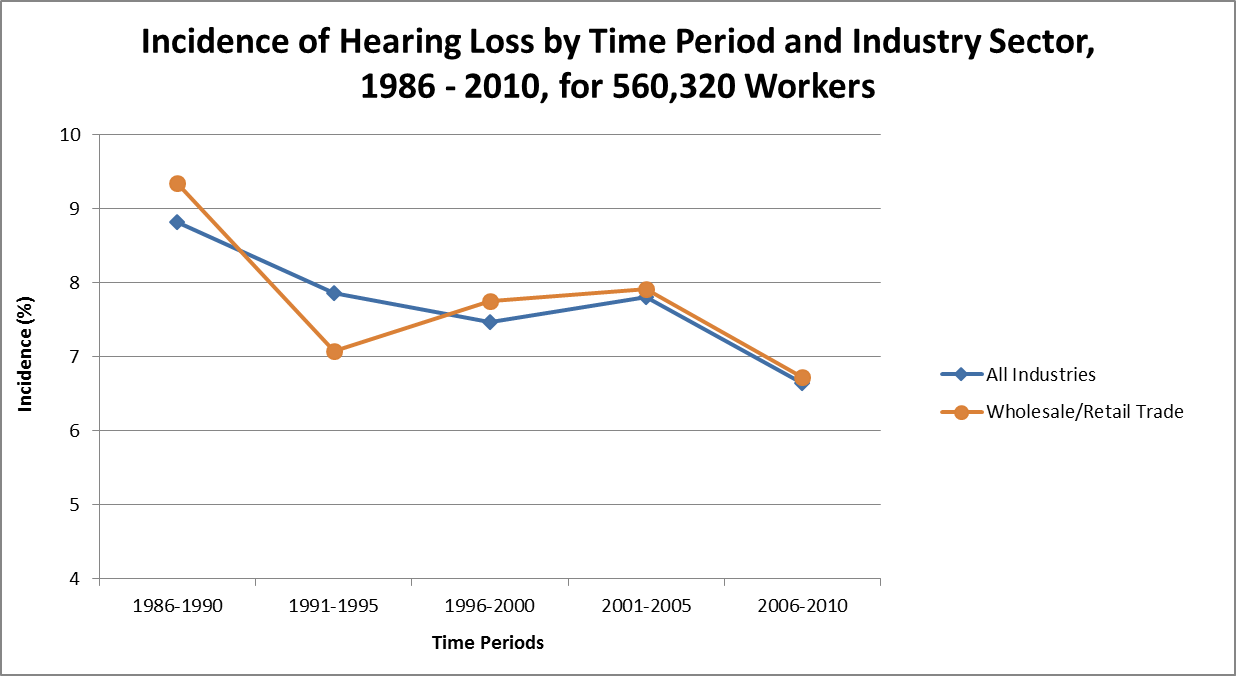
- The incidence for WRT decreased 3% over 25 years (1986-2010) as compared with a 2% reduction for all industries.
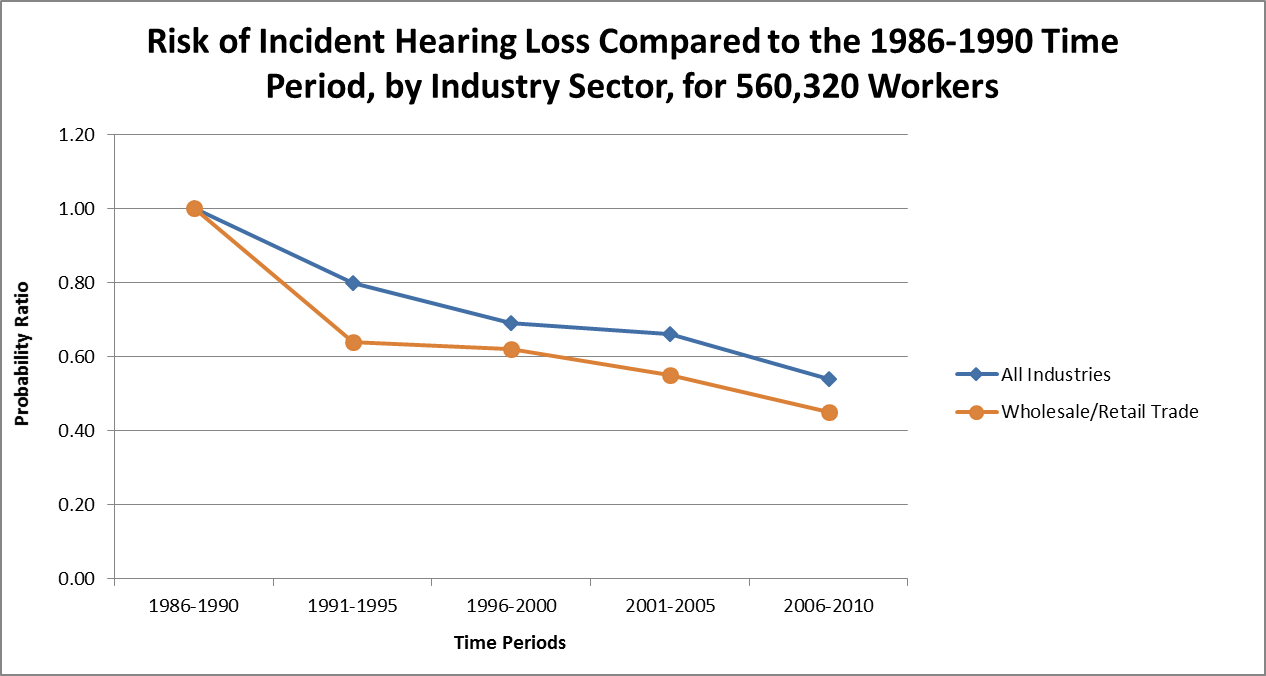
- The adjusted risk for WRT decreased 55% over 25 years (1986-2010) as compared with a 46% reduction for all industries.
Prevalence of Hearing Loss by Time Period and Industry Sector, 1981 – 2010, for 1,816,812 Workers

Adapted from Figure 1, Masterson et al. 2015
Adapted from Figure 1, Masterson et al. 2015
Incidence of Hearing Loss by Time Period and Industry Sector, 1986 – 2010, for 560,320 Workers

Adapted from Figure 2, Masterson et al. 2015
Adapted from Figure 2, Masterson et al. 2015
Risk of Incident Hearing Loss Compared to the 1986-1990 Time Period, by Industry Sector, for 560,320 Workers

Adapted from Figure 3, Masterson et al. 2015
Adapted from Figure 3, Masterson et al. 2015
Sources:
- Tak S, Davis RR, Calvert GM. (2009). Exposure to hazardous workplace noise and use of hearing protection devices among US workers — NHANES, 1999-2004. American Journal of Industrial Medicine, 52(5):358-371.
- Masterson EA, Themann CL, Luckhaupt SE, Li J. & Calvert GM. (2016). Hearing difficulty and tinnitus among U.S. workers and non-workers in 2007. American Journal of Industrial Medicine, 59, 290-300.
- Masterson EA, Deddens JA, Themann CL, Bertke S. & Calvert GM. (2015). Trends in worker hearing loss by industry sector, 1981-2010. American Journal of Industrial Medicine, 58, 392-401.
- Masterson EA, Bushnell PT, Themann CL, & Morata TC. (2016). Hearing impairment among noise-exposed workers — United States, 2003–2012. Morbidity and Mortality Weekly Report, 65(15), 389-394.
- Page last reviewed: June 6, 2017
- Page last updated: August 7, 2017
- Content source:
- National Institute for Occupational Safety and Health Division of Surveillance, Hazard Evaluations, and Field Studies