 |
|
|
|
|
|
|
| ||||||||||
|
|
|
|
|
|
|
||||
| ||||||||||
|
|
|
|
|
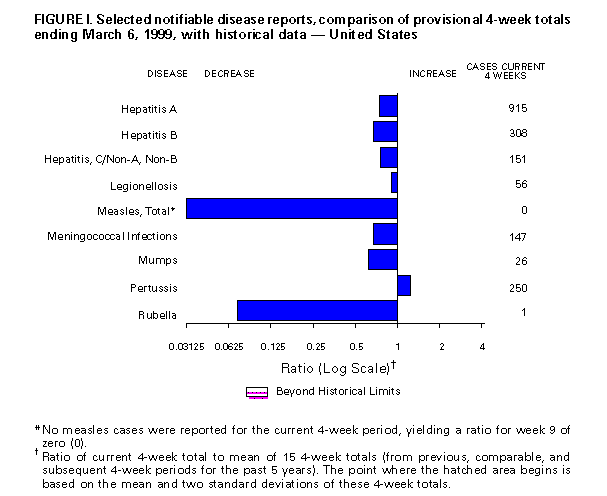
Persons using assistive technology might not be able to fully access information in this file. For assistance, please send e-mail to: mmwrq@cdc.gov. Type 508 Accommodation and the title of the report in the subject line of e-mail. Notifiable Diseases/Deaths in Selected Cities Weekly InformationFigure_I Selected notifiable disease reports, comparison of provisional 4-week totals ending March 6, 1999, with historical data -- United States Table_I Summary -- provisional cases of selected notifiable diseases, United States, cumulative, week ending March 6, 1999 (9th Week) Table_II Provisional cases of selected notifiable diseases, United States, weeks ending March 6, 1999 and March 7, 1998 (9th Week) Table_III Provisional cases of selected notifiable diseases preventable by vaccination, United States, weeks ending March 6, 1999 and March 7, 1998 (9th Week) Table_IV Deaths in 122 U.S. cities, week ending
March 6, 1999 (9th Week)
TABLE I. Summary -- provisional cases of specified notifiable diseases, United
States, cumulative, week ending March 6, 1999 (9th Week)
==================================================================================
                                             Cum. 1999
------------------------------------------------------
Anthrax                                              -
Brucellosis                                          8
Cholera                                              -
Congenital rubella syndrome                          -
Cryptosporidiosis*                                 172
Diphtheria                                           -
Encephalitis:  California*                           1
               eastern equine*                       -
               St. Louis*                            -
               western equine*                       -
Hansen Disease                                       9
Hantavirus pulmonary syndrome*+                      1
Hemolytic uremic syndrome, post-diarrheal*           5
HIV infection, pediatric*&                           7
Plague                                               -
Poliomyelitis, paralytic                             -
Psittacosis                                          4
Rabies, human                                        -
Rocky Mountain spotted fever (RMSF)                 24
Streptococcal disease, invasive Group A            241
Streptococcal toxic-shock syndrome*                  5
Syphilis, congenital@                                -
Tetanus                                              2
Toxic-shock syndrome                                15
Trichinosis                                          1
Typhoid fever                                       32
Yellow fever                                         -
------------------------------------------------------
-: no reported cases
 * Not notifiable in all states
 + Updated weekly from reports to the Division of Viral and Rickettsial
   Diseases, National Center for Infectious Diseases (NCID).
 & Updated monthly from reports to the Division of HIV/AIDS Prevention --
   Surveillance and Epidemiology, National Center for HIV, STD, and TB
   Prevention (NCHSTP), last update January 24, 1999.
 @ Updated from reports to the Division of STD Prevention, NCHSTP.

==================================================================================
Return to top. Table_II Note: To print large tables and graphs users may have to change their printer settings to landscape and use a small font size.
TABLE II. (page 1) Provisional cases of selected notifiable diseases, United States, weeks ending
March 6, 1999, and March 7, 1998 (9th Week)
Escherichia
coli O157:H7
------------------- Hepatitis
AIDS Chlamydia NETSS** PHLIS*** Gonorrhea C/NA,NB
----------------- -------------------- -------- -------- ------------------- ----------------
Cum. Cum. Cum. Cum. Cum. Cum. Cum. Cum. Cum. Cum.
Reporting Area 1999* 1998 1999 1998 1999 1999 1999 1998 1999 1998
------------------------------------------------------------------------------------------------------------------------------
UNITED STATES 3,137 7,332 78,510 98,646 174 72 45,259 58,752 396 634
NEW ENGLAND 158 198 2,614 3,770 26 23 819 1,087 40 19
Maine 3 4 124 177 1 - 9 8 - -
N.H. 3 10 160 165 1 1 15 19 - -
Vt. - 8 85 55 1 - 10 1 1 2
Mass. 124 70 1,530 1,518 17 13 519 385 39 17
R.I. 9 22 375 430 - - 98 59 - -
Conn. 19 84 340 1,425 6 9 168 615 - -
MID. ATLANTIC 489 2,103 12,199 14,320 11 1 6,559 8,255 24 53
Upstate N.Y. 17 299 N N 9 - 453 1,025 20 49
N.Y. City 237 1,154 6,540 6,215 - 1 3,216 2,905 - -
N.J. 162 284 1,041 2,018 2 - 672 1,260 - -
Pa. 73 366 4,618 6,087 N - 2,218 3,065 4 4
E.N. CENTRAL 179 509 12,728 14,902 33 8 8,855 11,345 92 87
Ohio 38 94 4,098 5,051 21 3 2,461 3,037 - 4
Ind. 25 79 - - 5 - 726 1,135 - 2
Ill. 77 247 4,796 3,700 2 - 3,008 3,202 1 11
Mich. 22 57 3,345 3,713 5 2 2,436 3,018 91 70
Wis. 17 32 489 2,438 N 3 224 953 - -
W.N. CENTRAL 110 147 2,879 6,175 30 12 1,078 2,550 2 74
Minn. 20 22 927 1,231 14 10 374 417 - -
Iowa 3 9 325 650 5 2 141 182 - 2
Mo. 72 77 - 2,144 1 - - 1,164 2 72
N. Dak. - 3 - 168 2 - - 16 - -
S. Dak. - 5 311 305 - - 29 51 - -
Nebr. 6 14 603 534 2 - 268 198 - -
Kans. 9 17 713 1,143 6 - 266 522 - -
S. ATLANTIC 883 1,855 19,166 18,889 22 7 15,108 15,117 34 18
Del. 13 36 524 400 1 - 302 265 - -
Md. 81 239 1,260 1,311 2 - 1,871 1,397 16 2
D.C. 8 189 N N - - 484 596 - -
Va. 54 112 2,131 2,144 5 2 1,810 1,298 6 1
W. Va. 10 19 373 901 - 1 81 288 2 -
N.C. 69 107 3,949 3,606 3 2 3,547 3,140 - 5
S.C. 60 126 4,269 2,983 1 1 2,230 2,037 1 -
Ga. 111 228 2,408 4,283 1 - 1,682 3,440 1 6
Fla. 477 799 4,252 3,261 9 1 3,101 2,656 8 4
E.S. CENTRAL 157 289 5,965 6,787 13 1 5,332 6,633 24 17
Ky. 15 39 - 1,062 5 - - 673 1 4
Tenn. 64 104 2,315 2,314 6 - 1,912 2,017 22 11
Ala. 31 86 2,504 1,689 2 - 2,269 2,235 1 2
Miss. 47 60 1,146 1,722 - 1 1,151 1,708 - -
W.S. CENTRAL 532 885 5,203 13,572 5 1 3,741 8,603 18 12
Ark. 19 33 783 618 2 - 352 1,008 2 2
La. 27 148 2,926 2,133 1 1 2,599 1,872 7 -
Okla. 6 52 1,494 1,379 1 - 790 769 - -
Tex. 480 652 - 9,442 1 - - 4,954 9 10
MOUNTAIN 45 199 4,333 4,825 12 2 1,156 1,346 38 92
Mont. - 8 208 158 - - 3 8 4 4
Idaho 4 5 275 340 - - 19 30 4 31
Wyo. - - 100 143 1 - 4 9 12 22
Colo. 26 39 1,161 1,181 3 1 320 469 4 7
N. Mex. 4 36 831 735 1 - 153 140 4 13
Ariz. 4 61 1,020 1,696 4 1 415 557 9 -
Utah 4 26 262 266 3 - 28 31 1 8
Nev. 3 24 476 306 - - 214 102 - 7
PACIFIC 584 1,147 13,423 15,406 22 17 2,611 3,816 124 262
Wash. 29 73 2,123 1,870 1 4 366 327 2 2
Oreg. 15 31 732 1,024 8 8 97 152 - 1
Calif. 525 1,028 10,107 11,805 13 5 2,067 3,205 122 225
Alaska 5 - 264 341 - - 48 55 - -
Hawaii 10 15 197 366 - - 33 77 - 34
Guam 1 - - 47 N - - 4 - -
P.R. 92 271 U U 1 U 54 79 - -
V.I. - 8 N N N U U U U U
Amer. Samoa - - U U N U U U U U
C.N.M.I. - - N N N U - 7 - -
------------------------------------------------------------------------------------------------------------------------------
N: Not notifiable U: Unavailable -: no reported cases C.N.M.I.: Commonwealth of North Mariana Islands
* Updated monthly from reports to the Division of HIV/AIDS Prevention -- Surveillance and Epidemiology, National Center for HIV,
STD, and TB Prevention, last update January 24, 1999.
** National Electronic Telecommunications System for Surveillance.
*** Public Health Laboratory Information System.
=======================================================================================================================================================
TABLE II. (page 2) Provisional cases of selected notifiable diseases, United States, weeks ending
March 6, 1999, and March 7, 1998 (9th Week)
Lyme Syphilis Rabies,
Legionellosis Disease Malaria (Primary & Secondary) Tuberculosis Animal
---------------- ---------------- ---------------- --------------------- ----------------- -------
Cum. Cum. Cum. Cum. Cum. Cum. Cum. Cum. Cum. Cum. Cum.
Reporting Area 1999 1998 1999 1998 1999 1998 1999 1998 1999 * 1998 * 1999
-------------------------------------------------------------------------------------------------------------------------------------------
UNITED STATES 129 204 528 575 161 194 925 1,239 628 1,117 680
NEW ENGLAND 11 15 77 83 3 6 14 13 41 50 109
Maine 2 - - 1 - - - - 1 - 19
N.H. 1 2 - 1 - - - 1 - - 4
Vt. 3 - - 1 - - 1 - - 1 18
Mass. 2 5 65 22 3 6 9 11 12 23 31
R.I. 1 3 - 9 - - 1 - 15 8 10
Conn. 2 5 12 49 - - 3 1 13 18 27
MID. ATLANTIC 33 41 311 374 43 73 38 72 217 241 166
Upstate N.Y. 8 10 89 144 12 19 4 4 9 30 108
N.Y. City - 10 1 10 10 40 14 7 132 152 U
N.J. 5 1 85 42 14 7 1 15 76 59 37
Pa. 20 20 136 178 7 7 19 46 U U 21
E.N. CENTRAL 31 72 17 15 12 18 197 184 29 17 1
Ohio 14 20 11 10 2 1 17 36 U U -
Ind. 5 11 5 4 4 1 32 30 U U -
Ill. - 14 - - - 9 122 65 U U -
Mich. 12 13 1 1 5 6 26 38 25 - 1
Wis. - 14 U U 1 1 - 15 4 17 -
W.N. CENTRAL 1 12 5 5 5 7 5 31 56 51 61
Minn. - - 1 - - 1 - 1 32 18 17
Iowa 1 - 1 5 2 1 1 - - - 16
Mo. - 6 - - 3 4 - 20 19 28 -
N. Dak. - - 1 - - - - - - - 15
S. Dak. - - - - - - - - 2 - -
Nebr. - 6 - - - - 1 4 1 - 1
Kans. - - 2 - - 1 3 6 2 5 12
S. ATLANTIC 21 28 72 68 48 41 367 459 109 247 260
Del. 2 4 - - - 1 1 5 - 3 -
Md. 1 7 58 63 17 18 78 133 U U 58
D.C. - 2 1 3 5 2 10 14 8 19 -
Va. 2 3 - - 7 4 27 39 9 30 61
W. Va. N N - - 1 - 1 - 7 12 15
N.C. 4 3 11 - 3 4 113 128 45 128 62
S.C. 4 3 - - - - 43 47 40 55 11
Ga. - - - 2 4 9 46 37 U U 28
Fla. 8 6 2 - 11 3 48 56 U U 25
E.S. CENTRAL 6 8 8 9 3 5 159 225 50 92 40
Ky. 2 4 - - - - - 24 U U 13
Tenn. 4 2 3 5 2 3 89 114 U U 18
Ala. - 1 5 4 1 1 58 48 44 61 9
Miss. - 1 - - - 1 12 39 6 31 -
W.S. CENTRAL 1 1 - - 5 3 106 155 26 318 5
Ark. - - - - - - 19 17 14 5 -
La. 1 - - - 3 2 41 66 U U -
Okla. - - - - 1 - 46 9 12 20 5
Tex. - 1 - - 1 1 - 63 - 293 -
MOUNTAIN 11 11 1 1 8 10 14 46 21 45 18
Mont. - 1 - - 1 - - - - 2 8
Idaho - - - - 1 1 - - - - -
Wyo. - - - - - - - - - 1 5
Colo. 1 4 - - 3 3 - 3 U U 1
N. Mex. 1 1 1 - 1 3 - 4 6 8 -
Ariz. 1 - - - 2 2 13 34 U U 4
Utah 4 4 - - - 1 - 2 9 6 -
Nev. 4 1 - 1 - - 1 3 6 28 -
PACIFIC 14 16 37 20 34 31 25 54 79 56 20
Wash. 2 - - - 2 - 5 4 45 32 -
Oreg. - - 1 - 4 5 - 1 U U -
Calif. 12 16 36 20 27 26 19 49 U U 18
Alaska - - - - - - - - 6 7 2
Hawaii - - - - 1 - 1 - 28 17 -
Guam - 1 - - - - - - - 18 -
P.R. - - - - - - 43 36 - 6 7
V.I. U U U U U U U U U U U
Amer. Samoa U U U U U U U U U U U
C.N.M.I. - - - - - - - 8 - 15 -
-------------------------------------------------------------------------------------------------------------------------------------------
N: Not notifiable U: Unavailable -: no reported cases
* Cumulative reports of provisional tuberculosis cases for 1998 and 1999 are unavailable ('U') for some areas using the Tuberculosis
Information Management System (TIMS).
=======================================================================================================================================================
Return to top. Table_III Note: To print large tables and graphs users may have to change their printer settings to landscape and use a small font size.
TABLE III. (page 1) Provisional cases of selected notifiable diseases preventable by vaccination, United
States, weeks ending March 6, 1999, and March 7, 1998 (9th Week)
Hepatitis (Viral), by type Measles (Rubeola)
H. influenzae, --------------------------------------- ------------------------------------------------------------
invasive A B Indigenous Imported** Total
---------------- ----------------- ----------------- --------------- --------------- ---------------
Cum. Cum. Cum. Cum. Cum. Cum. Cum. Cum. Cum. Cum.
Reporting Area 1999* 1998 1999 1998 1999 1998 1999 1999 1999 1999 1999 1998
-----------------------------------------------------------------------------------------------------------------------------------------------------
UNITED STATES 180 206 2,406 3,199 842 1,384 - 7 - 4 11 4
NEW ENGLAND 14 13 26 70 10 21 - - - 1 1 1
Maine 1 - 2 8 - - - - - - - -
N.H. 2 1 4 3 2 2 - - - 1 1 -
Vt. 3 - - 3 - - - - - - - -
Mass. 8 12 7 17 6 11 - - - - - 1
R.I. - - - 5 2 - - - - - - -
Conn. - - 13 34 - 8 - - - - - -
MID. ATLANTIC 25 31 145 257 102 212 - - - - - 1
Upstate N.Y. 15 12 43 59 25 52 - - - - - -
N.Y. City - 10 17 97 12 56 - - - - - -
N.J. 10 9 25 49 19 36 - - - - - 1
Pa. - - 60 52 46 68 - - - - - -
E.N. CENTRAL 20 33 607 554 79 346 - - - - - 1
Ohio 13 15 125 71 19 13 - - - - - -
Ind. 1 2 29 74 4 175 - - - - - -
Ill. 5 15 60 146 - 49 - - - - - -
Mich. 1 - 391 229 56 88 - - - - - 1
Wis. - 1 2 34 - 21 - - - - - -
W.N. CENTRAL 8 1 59 294 24 71 - - - - - -
Minn. 2 - 4 5 4 2 - - - - - -
Iowa 2 - 18 105 8 10 - - - - - -
Mo. - - 16 151 4 51 - - - - - -
N. Dak. - - - 1 - - - - - - - -
S. Dak. 1 - - 1 - 1 - - - - - -
Nebr. 1 - 13 4 6 2 - - - - - -
Kans. 2 1 8 27 2 5 - - - - - -
S. ATLANTIC 48 39 251 249 154 149 - - - - - 1
Del. - - - - - - - - - - - -
Md. 20 12 66 68 30 31 - - - - - 1
D.C. - - 11 10 4 2 - - - - - -
Va. 2 5 14 32 8 13 - - - - - -
W. Va. 1 1 1 - - - - - - - - -
N.C. 5 3 25 14 39 48 - - - - - -
S.C. 2 - 1 7 16 - - - - - - -
Ga. 9 13 57 79 15 39 - - - - - -
Fla. 9 5 76 39 42 16 - - - - - -
E.S. CENTRAL 15 14 77 98 63 71 - - - - - -
Ky. 2 3 6 2 7 3 - - - - - -
Tenn. 8 6 49 51 42 55 - - - - - -
Ala. 4 5 21 27 14 13 - - - - - -
Miss. 1 - 1 18 - - - - - - - -
W.S. CENTRAL 10 11 177 227 28 95 - - - 2 2 -
Ark. - - 6 6 7 20 - - - - - -
La. 3 5 9 4 5 5 - - - - - -
Okla. 5 4 59 82 8 7 - - - - - -
Tex. 2 2 103 135 8 63 - - - 2 2 -
MOUNTAIN 25 38 248 571 84 139 - 1 - - 1 -
Mont. 1 - 3 6 1 1 - - - - - -
Idaho 1 - 8 40 4 4 - - - - - -
Wyo. 1 - 1 10 - 1 U - U - - -
Colo. 1 7 59 49 18 15 - 1 - - 1 -
N. Mex. 6 - 5 35 33 50 - - - - - -
Ariz. 11 19 131 347 11 36 - - - - - -
Utah 4 2 12 36 7 16 - - - - - -
Nev. - 10 29 48 10 16 - - - - - -
PACIFIC 15 26 816 879 298 280 - 6 - 1 7 -
Wash. - 1 50 80 2 16 - - - - - -
Oreg. 6 12 38 61 10 24 - 6 - - 6 -
Calif. 8 10 725 725 282 233 - - - 1 1 -
Alaska 1 1 2 1 2 2 - - - - - -
Hawaii - 2 1 12 2 5 - - - - - -
Guam - - - - - - U - U - - -
P.R. - 1 9 6 13 81 - - - - - -
V.I. U U U U U U U U U U U U
Amer. Samoa U U U U U U U U U U U U
C.N.M.I. - - - - - 14 U - U - - -
-----------------------------------------------------------------------------------------------------------------------------------------------------
N: Not notifiable U: Unavailable -: no reported cases
* Of 33 cases among children aged <5 years, serotype was reported for 11 and of those, 2 were type b.
** For imported measles, cases include only those resulting from importation from other countries.
=======================================================================================================================================================
TABLE III. (page 2) Provisional cases of selected notifiable diseases preventable by vaccination, United
States, weeks ending March 6, 1999, and March 7, 1998 (9th Week)
Meningococcal
Disease Mumps Pertussis Rubella
----------------- -------------------------- --------------------------- ---------------------------
Cum. Cum. Cum. Cum. Cum. Cum. Cum. Cum.
Reporting Area 1999 1998 1999 1999 1998 1999 1999 1998 1999 1999 1998
------------------------------------------------------------------------------------------------------------------------------------------
UNITED STATES 399 633 7 60 69 131 545 686 1 5 63
NEW ENGLAND 21 36 - 1 - 6 81 141 - - 13
Maine 3 3 - - - - - 4 - - -
N.H. - 1 - 1 - 3 17 14 - - -
Vt. 2 1 - - - - 10 24 - - -
Mass. 15 14 - - - 3 54 96 - - 1
R.I. 1 3 - - - - - - - - -
Conn. - 14 - - - - - 3 - - 12
MID. ATLANTIC 43 66 1 6 6 48 80 74 - - 41
Upstate N.Y. 8 16 - 2 2 33 57 49 - - 37
N.Y. City 13 10 - - 4 - - 4 - - -
N.J. 13 18 - - - - - 6 - - 4
Pa. 9 22 1 4 - 15 23 15 - - -
E.N. CENTRAL 60 106 3 5 9 8 67 77 - - -
Ohio 29 39 1 2 6 6 56 31 - - -
Ind. 7 19 - - - - 2 4 - - -
Ill. 17 23 - - - - - 1 - - -
Mich. 7 10 2 3 3 2 9 11 - - -
Wis. - 15 - - - - - 30 - - -
W.N. CENTRAL 26 48 1 2 5 - 5 49 - - -
Minn. 2 - - - 4 - - 28 - - -
Iowa 9 9 1 2 1 - 3 10 - - -
Mo. 6 24 - - - - 1 5 - - -
N. Dak. - - - - - - - - - - -
S. Dak. 4 4 - - - - 1 - - - -
Nebr. 2 1 - - - - - 2 - - -
Kans. 3 10 - - - - - 4 - - -
S. ATLANTIC 76 95 1 12 12 5 52 54 - 3 1
Del. 1 1 - - - - - - - - -
Md. 12 13 - 2 - - 17 11 - - -
D.C. 1 - - 1 - - - - - - -
Va. 5 10 1 2 2 - 7 - - - -
W. Va. 1 3 - - - - - - - - -
N.C. 8 18 - 1 5 2 18 30 - 3 1
S.C. 11 10 - 2 3 1 4 5 - - -
Ga. 14 29 - - - - - - - - -
Fla. 23 11 - 4 2 2 6 8 - - -
E.S. CENTRAL 33 52 - 1 - 4 14 13 - - -
Ky. 10 9 - - - - 1 - - - -
Tenn. 11 18 - - - 3 9 4 - - -
Ala. 8 21 - 1 - 1 4 9 - - -
Miss. 4 4 - - - - - - - - -
W.S. CENTRAL 21 35 - 9 13 3 18 19 1 2 2
Ark. 7 6 - - - - 3 3 - - -
La. 6 10 - - - - - - - - -
Okla. 7 15 - 1 - - 2 - - - -
Tex. 1 4 - 8 13 3 13 16 1 2 2
MOUNTAIN 39 46 - 4 4 21 124 134 - - 5
Mont. - 2 - - - - - 1 - - -
Idaho 5 2 - - - 6 72 62 - - -
Wyo. 1 3 U - 1 U 1 - U - -
Colo. 8 12 - 2 - 3 8 19 - - -
N. Mex. 7 6 N N N - 7 39 - - 1
Ariz. 13 17 - - 1 11 18 7 - - 1
Utah 3 3 - 1 - - 16 3 - - 2
Nev. 2 1 - 1 2 1 2 3 - - 1
PACIFIC 80 149 1 20 20 36 104 125 - - 1
Wash. 10 20 - - 1 31 42 47 - - -
Oreg. 10 31 N N N - 3 8 - - -
Calif. 53 95 1 18 12 5 58 70 - - 1
Alaska 3 1 - 1 2 - 1 - - - -
Hawaii 4 2 - 1 5 - - - - - -
Guam - - U - 1 U - - U - -
P.R. 1 - - - - - - 2 - - -
V.I. U U U U U U U U U U U
Amer. Samoa U U U U U U U U U U U
C.N.M.I. - - U - 2 U - - U - -
------------------------------------------------------------------------------------------------------------------------------------------
N: Not notifiable U: Unavailable -: no reported cases
=======================================================================================================================================================
Return to top. Table_IV Note: To print large tables and graphs users may have to change their printer settings to landscape and use a small font size.
TABLE IV. Deaths in 122 U.S. cities,* week ending
March 6, 1999 (9th Week)
===================================================================================================================================
All Causes, By Age (Years)
------------------------------------------------------------------------ P&I**
Reporting Area All Ages >=65 45-64 25-44 1-24 <1 Total
---------------------------------------------------------------------------------------------------------------
NEW ENGLAND 602 443 113 31 9 6 86
Boston, Mass. 193 128 49 10 3 3 26
Bridgeport, Conn. 41 30 10 1 - - 5
Cambridge, Mass. 25 23 1 1 - - 2
Fall River, Mass. 47 39 5 3 - - 3
Hartford, Conn. U U U U U U U
Lowell, Mass. 38 30 6 2 - - 7
Lynn, Mass. 22 17 - 2 3 - 1
New Bedford, Mass. 29 22 6 1 - - 5
New Haven, Conn. 50 35 9 3 1 2 9
Providence, R.I. U U U U U U U
Somerville, Mass. 9 7 2 - - - -
Springfield, Mass. 55 41 10 4 - - 11
Waterbury, Conn. 20 15 3 - 1 1 1
Worcester, Mass. 73 56 12 4 1 - 16
MID. ATLANTIC 2,623 1,859 504 173 40 47 146
Albany, N.Y. 73 51 16 4 1 1 6
Allentown, Pa. 20 16 4 - - - -
Buffalo, N.Y. 108 78 20 7 1 2 3
Camden, N.J. 33 23 5 2 1 2 3
Elizabeth, N.J. 14 11 2 1 - - -
Erie, Pa. 52 43 6 - 1 2 8
Jersey City, N.J. 63 43 13 6 - 1 -
New York City, N.Y. 1,268 899 245 85 20 19 31
Newark, N.J. 73 36 22 9 3 3 9
Paterson, N.J. U U U U U U U
Philadelphia, Pa. 499 323 110 42 11 13 43
Pittsburgh, Pa.*** 65 51 10 3 - 1 5
Reading, Pa. 24 21 2 - - 1 1
Rochester, N.Y. 107 83 18 5 - 1 16
Schenectady, N.Y. 35 30 3 2 - - 3
Scranton, Pa. 32 29 2 - 1 - 1
Syracuse, N.Y. 104 85 16 3 - - 15
Trenton, N.J. 29 15 9 3 1 1 2
Utica, N.Y. 24 22 1 1 - - -
Yonkers, N.Y. U U U U U U U
E.N. CENTRAL 2,543 1,829 453 163 48 47 199
Akron, Ohio 52 38 8 1 4 1 -
Canton, Ohio 42 33 7 1 - 1 5
Chicago, Ill. 508 340 102 44 9 10 39
Cincinnati, Ohio 93 61 24 7 1 - 11
Cleveland, Ohio 185 131 29 14 6 5 7
Columbus, Ohio 246 178 40 20 5 3 29
Dayton, Ohio 158 131 20 5 - 2 14
Detroit, Mich. 257 168 56 23 4 6 8
Evansville, Ind. 55 49 5 1 - - 4
Fort Wayne, Ind. 82 64 16 2 - - 8
Gary, Ind. 30 14 11 5 - - 1
Grand Rapids, Mich. 46 31 13 1 - 1 -
Indianapolis, Ind. 367 268 55 21 12 11 32
Lansing, Mich. 53 41 11 1 - - 6
Milwaukee, Wis. 127 89 27 7 3 1 12
Peoria, Ill. 45 35 6 2 - 2 -
Rockford, Ill. 60 44 11 4 - 1 11
South Bend, Ind. 50 42 4 1 2 1 7
Toledo, Ohio U U U U U U U
Youngstown, Ohio 87 72 8 3 2 2 5
W.N. CENTRAL 883 651 154 52 10 16 89
Des Moines, Iowa U U U U U U U
Duluth, Minn. 56 44 9 3 - - 14
Kansas City, Kans. U U U U U U U
Kansas City, Mo. 142 107 25 6 2 2 20
Lincoln, Nebr. 47 36 6 4 1 - 7
Minneapolis, Minn. 304 224 55 16 5 4 27
Omaha, Nebr. 125 80 32 9 1 3 13
St. Louis, Mo. 114 83 14 11 1 5 -
St. Paul, Minn. 95 77 13 3 - 2 8
Wichita, Kans. U U U U U U U
S. ATLANTIC 1,305 917 234 105 24 24 102
Atlanta, Ga. U U U U U U U
Baltimore, Md. 216 142 46 17 6 4 36
Charlotte, N.C. 115 85 21 4 - 5 13
Jacksonville, Fla. 178 130 27 16 2 3 7
Miami, Fla. 115 74 25 10 4 2 -
Norfolk, Va. 61 46 7 4 2 2 2
Richmond, Va. 76 54 12 7 1 2 4
Savannah, Ga. 45 33 11 - 1 - 4
St. Petersburg, Fla. 107 84 13 9 - 1 7
Tampa, Fla. 209 152 35 16 3 3 25
Washington, D.C. 159 98 32 22 5 2 4
Wilmington, Del. 24 19 5 - - - -
E.S. CENTRAL 924 628 196 59 20 18 57
Birmingham, Ala. 218 145 48 12 4 6 21
Chattanooga, Tenn. 50 35 13 - 1 1 3
Knoxville, Tenn. 90 71 14 2 2 1 2
Lexington, Ky. 60 39 13 5 1 2 2
Memphis, Tenn. 196 131 38 19 5 3 18
Mobile, Ala. 112 68 31 8 3 2 -
Montgomery, Ala. 68 52 13 1 1 1 8
Nashville, Tenn. 130 87 26 12 3 2 3
W.S. CENTRAL 1,367 955 257 98 27 30 106
Austin, Tex. 86 56 21 5 1 3 11
Baton Rouge, La. 105 69 21 9 2 4 6
Corpus Christi, Tex. 68 52 11 2 2 1 8
Dallas, Tex. 246 158 55 23 6 4 4
El Paso, Tex. 72 48 17 3 3 1 3
Ft. Worth, Tex. 124 99 12 9 2 2 16
Houston, Tex. U U U U U U U
Little Rock, Ark. 88 57 18 5 4 4 7
New Orleans, La. 125 77 31 12 2 3 9
San Antonio, Tex. 266 207 32 21 2 4 28
Shreveport, La. 60 40 14 4 2 - 3
Tulsa, Okla. 127 92 25 5 1 4 11
MOUNTAIN 1,112 815 188 65 26 17 122
Albuquerque, N.M. 101 78 9 10 2 2 9
Boise, Idaho 44 35 8 1 - - 2
Colo. Springs, Colo. 56 39 10 7 - - 9
Denver, Colo. 136 102 19 6 2 6 10
Las Vegas, Nev. 253 172 58 13 8 2 24
Ogden, Utah 53 42 9 2 - - 5
Phoenix, Ariz. 81 54 17 3 5 2 -
Pueblo, Colo. 23 18 2 2 1 - -
Salt Lake City, Utah 139 98 25 10 4 2 27
Tucson, Ariz. 226 177 31 11 4 3 36
PACIFIC 2,299 1,720 375 123 40 39 252
Berkeley, Calif. 20 14 5 1 - - 6
Fresno, Calif. 132 100 22 5 4 1 13
Glendale, Calif. 24 20 4 - - - -
Honolulu, Hawaii 77 62 10 2 2 1 5
Long Beach, Calif. 62 43 12 5 2 - 12
Los Angeles, Calif. 544 412 85 29 11 7 34
Pasadena, Calif. 32 24 5 1 - 2 5
Portland, Oreg. 157 121 18 11 2 5 13
Sacramento, Calif. 349 269 45 21 7 7 77
San Diego, Calif. 141 104 25 7 1 4 14
San Francisco, Calif. 159 117 29 7 3 3 17
San Jose, Calif. 195 139 36 15 3 2 23
Santa Cruz, Calif. 30 22 5 1 1 1 3
Seattle, Wash. 175 129 30 11 - 5 10
Spokane, Wash. 68 51 15 - 1 1 9
Tacoma, Wash. 134 93 29 7 3 - 11
TOTAL 13,658**** 9,817 2,474 869 244 244 1,159
---------------------------------------------------------------------------------------------------------------
U: Unavailable -: no reported cases
* Mortality data in this table are voluntarily reported from 122 cities in the United States, most of which have populations
of 100,000 or more. A death is reported by the place of its occurrence and by the week that the death certificate was
filed. Fetal deaths are not included.
** Pneumonia and influenza.
*** Because of changes in reporting methods in this Pennsylvania city, these numbers are partial counts for the current
week. Complete counts will be available in 4 to 6 weeks.
**** Total includes unknown ages.
===================================================================================================================================
Return to top. Disclaimer All MMWR HTML versions of articles are electronic conversions from ASCII text into HTML. This conversion may have resulted in character translation or format errors in the HTML version. Users should not rely on this HTML document, but are referred to the electronic PDF version and/or the original MMWR paper copy for the official text, figures, and tables. An original paper copy of this issue can be obtained from the Superintendent of Documents, U.S. Government Printing Office (GPO), Washington, DC 20402-9371; telephone: (202) 512-1800. Contact GPO for current prices. **Questions or messages regarding errors in formatting should be addressed to mmwrq@cdc.gov.Page converted: 03/11/99 |
|||||||||
This page last reviewed 5/2/01
|