 |
|
|
|
|
|
|
| ||||||||||
|
|
|
|
|
|
|
||||
| ||||||||||
|
|
|
|
|
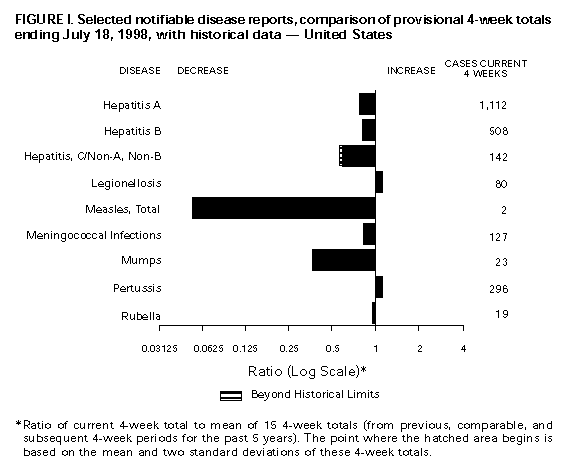
Persons using assistive technology might not be able to fully access information in this file. For assistance, please send e-mail to: mmwrq@cdc.gov. Type 508 Accommodation and the title of the report in the subject line of e-mail. Notifiable Diseases/Deaths in Selected Cities Weekly InformationFigure_I Selected notifiable disease reports, comparison of provisional 4-week totals ending July 18, 1998, with historical data -- United States Table_I Summary -- provisional cases of selected notifiable diseases, United States, cumulative, week ending July 18, 1998 (28th Week) Table_II Provisional cases of selected notifiable diseases, United States, weeks ending July 18, 1998 and July 12, 1997 (28th Week) Table_III Provisional cases of selected notifiable diseases preventable by vaccination, United States, weeks ending July 18, 1998 and July 12, 1997 (28th Week) Table_IV Deaths in 122 U.S. cities, week ending
July 18, 1998 (28th Week)
TABLE I. Summary -- provisional cases of specified notifiable diseases, United
States, cumulative, week ending July 18, 1998 (28th Week)
==================================================================================
                                             Cum. 1998
------------------------------------------------------
Anthrax                                              -
Brucellosis                                         39
Cholera                                              6
Congenital rubella syndrome                          5
Cryptosporidiosis*                                 996
Diphtheria                                           1
Encephalitis:  California*                           2
               eastern equine*                       -
               St. Louis*                            -
               western equine*                       -
Hansen Disease                                      60
Hantavirus pulmonary syndrome*+                      5
Hemolytic uremic syndrome, post-diarrheal*          20
HIV infection, pediatric*&                         127
Plague                                               3
Poliomyelitis, paralytic                             1
Psittacosis                                         27
Rabies, human                                        -
Rocky Mountain spotted fever (RMSF)                115
Streptococcal disease, invasive Group A          1,348
Streptococcal toxic-shock syndrome*                 35
Syphilis, congenital@                              131
Tetanus                                             16
Toxic-shock syndrome                                70
Trichinosis                                          6
Typhoid fever                                      148
Yellow fever                                         -
------------------------------------------------------
-: no reported cases
 * Not notifiable in all states
 + Updated weekly from reports to the Division of Viral and Rickettsial
   Diseases, National Center for Infectious Diseases (NCID).
 & Updated monthly to the Division of HIV/AIDS Prevention -- Surveillance
   and Epidemiology, National Center for HIV, STD, and TB Prevention
   (NCHSTP), last update June 28, 1998.
 @ One suspected case(s) of polio with onset in 1998 have also been reported
   to date.
** Updated from reports to the Division of STD Prevention, NCHSTP.

==================================================================================
Return to top. Table_II Note: To print large tables and graphs users may have to change their printer settings to landscape and use a small font size.
TABLE II. (page 1) Provisional cases of selected notifiable diseases, United States, weeks ending
July 18, 1998, and July 12, 1997 (28th Week)
Escherichia
coli O157:H7
------------------- Hepatitis
AIDS* Chlamydia NETSS** PHLIS*** Gonorrhea C\NA,NB
----------------- -------------------- -------- -------- ------------------- ----------------
Cum. Cum. Cum. Cum. Cum. Cum. Cum. Cum. Cum. Cum.
Reporting Area 1998 1997 1998 1997 1998 1998 1998 1997 1998 1997
------------------------------------------------------------------------------------------------------------------------------
UNITED STATES 23,929 31,393 283,518 239,135 1,040 468 163,996 151,165 2,097 1,828
NEW ENGLAND 830 1,270 10,984 9,157 139 98 3,058 3,118 31 36
Maine 18 28 560 500 16 - 36 29 - -
N.H. 22 17 496 410 22 21 48 59 - -
Vt. 10 24 215 207 7 4 15 26 - 1
Mass. 386 463 4,478 3,777 68 57 1,067 1,170 28 31
R.I. 67 83 1,311 1,067 5 1 186 251 3 4
Conn. 327 655 3,924 3,196 21 15 1,706 1,583 - -
MID. ATLANTIC 6,951 9,906 33,106 28,880 96 22 18,476 18,643 217 172
Upstate N.Y. 849 1,620 N N 72 - 3,215 3,148 167 125
N.Y. City 3,910 4,966 18,216 14,017 4 6 7,952 7,057 - -
N.J. 1,232 2,090 5,208 5,205 20 15 2,880 3,861 - -
Pa. 960 1,230 9,682 9,658 N 1 4,429 4,577 50 47
E.N. CENTRAL 1,768 2,169 46,186 38,755 189 85 31,449 23,439 277 340
Ohio 331 435 12,997 11,693 48 20 7,988 7,305 7 8
Ind. 326 360 3,078 4,673 54 25 1,958 3,129 3 10
Ill. 706 761 13,507 6,961 43 - 10,871 3,427 16 57
Mich. 305 473 11,612 9,672 44 20 8,620 7,202 251 246
Wis. 100 140 4,992 5,756 N 20 2,012 2,376 - 19
W.N. CENTRAL 444 614 16,585 16,766 137 67 8,170 7,563 118 38
Minn. 65 99 3,098 3,470 51 30 1,081 1,216 6 3
Iowa 49 69 2,010 2,459 44 7 638 667 11 19
Mo. 209 295 6,329 6,218 13 21 4,685 4,092 96 5
N. Dak. 4 6 290 453 2 5 29 34 - 2
S. Dak. 9 3 871 658 8 1 143 70 - -
Nebr. 39 59 1,268 1,052 8 - 448 403 2 2
Kans. 69 83 2,719 2,456 11 3 1,146 1,081 3 7
S. ATLANTIC 5,900 7,791 58,501 50,169 77 32 47,358 48,589 108 120
Del. 75 144 1,349 - - 1 733 616 - -
Md. 718 954 4,536 3,789 13 4 5,197 6,187 5 3
D.C. 481 598 N N 1 - 1,911 2,216 - -
Va. 425 650 5,581 6,198 N 7 3,339 4,254 7 17
W. Va. 57 62 1,426 1,552 N 3 410 497 4 9
N.C. 390 429 11,679 8,972 14 10 9,821 8,622 14 30
S.C. 386 422 9,968 6,740 3 1 6,404 6,024 3 26
Ga. 616 970 13,160 9,334 24 - 10,854 10,636 9 -
Fla. 2,752 3,562 10,802 13,584 19 6 8,689 9,537 66 35
E.S. CENTRAL 936 1,019 19,225 18,073 54 13 18,142 18,025 84 198
Ky. 127 177 3,311 3,545 15 - 1,876 2,234 16 9
Tenn. 333 414 6,897 6,659 24 10 5,912 5,548 65 129
Ala. 274 239 5,357 4,352 15 2 6,666 6,219 3 6
Miss. 202 189 3,660 3,517 U 1 3,688 4,024 U 54
W.S. CENTRAL 2,899 3,184 42,035 29,751 64 8 23,878 19,777 526 220
Ark. 104 130 1,860 1,538 4 3 1,182 2,531 3 8
La. 512 562 7,513 4,627 3 2 6,174 4,301 15 116
Okla. 170 165 5,287 4,013 9 3 2,926 2,496 5 4
Tex. 2,113 2,327 27,375 19,573 48 - 13,596 10,449 503 92
MOUNTAIN 831 924 11,454 14,797 142 55 4,174 4,048 244 165
Mont. 15 22 655 559 6 - 25 23 5 12
Idaho 15 28 919 790 10 2 85 59 87 28
Wyo. 2 13 350 300 46 - 17 28 44 40
Colo. 147 224 - 3,234 28 20 1,224 1,113 15 18
N. Mex. 130 80 2,075 2,060 12 6 411 477 56 32
Ariz. 329 227 5,923 5,441 N 11 2,148 1,751 3 22
Utah 65 73 1,223 854 20 10 126 124 21 3
Nev. 128 257 309 1,559 7 6 138 473 13 10
PACIFIC 3,370 4,516 45,442 32,787 142 88 9,291 7,963 492 539
Wash. 236 377 5,903 4,740 28 22 1,023 998 10 17
Oreg. 93 162 3,023 2,570 35 28 424 394 2 2
Calif. 2,962 3,913 34,507 23,785 77 35 7,478 6,093 425 431
Alaska 12 28 991 775 2 - 163 215 1 -
Hawaii 67 36 1,018 917 N 3 203 263 54 89
Guam - 2 8 193 N - 2 27 - -
P.R. 1,001 1,019 U U - U 227 345 - -
V.I. 17 51 N N N U U U U U
Amer. Samoa - - U U N U U U U U
C.N.M.I. - 1 N N N U 14 16 - 2
------------------------------------------------------------------------------------------------------------------------------
N: Not notifiable U: Unavailable -: no reported cases C.N.M.I.: Commonwealth of North Mariana Islands
* Updated monthly to the Division of HIV/AIDS Prevention, -- Surveillance and Epidemiology, National Center for HIV, STD,
and TB Prevention, last update June 28, 1998.
** National Electronic Telecommunications System for Surveillance.
*** Public Health Laboratory Information System.
=======================================================================================================================================================
TABLE II. (page 2) Provisional cases of selected notifiable diseases, United States, weeks ending
July 18, 1998, and July 12, 1997 (28th Week)
Lyme Syphilis Rabies,
Legionellosis Disease Malaria (Primary & Secondary) Tuberculosis Animal
---------------- ---------------- ---------------- --------------------- ----------------- -------
Cum. Cum. Cum. Cum. Cum. Cum. Cum. Cum. Cum. Cum. Cum.
Reporting Area 1998 1997 1998 1997 1998 1997 1998 1997 1998 * 1997 1998
-------------------------------------------------------------------------------------------------------------------------------------------
UNITED STATES 572 447 3,965 2,906 612 844 3,689 4,565 6,864 9,207 3,722
NEW ENGLAND 32 29 1,315 702 38 44 40 93 229 233 705
Maine 1 1 6 6 4 1 1 - 4 15 114
N.H. 3 4 21 7 3 2 1 - 6 9 34
Vt. 2 4 5 3 - 2 4 - 1 3 31
Mass. 10 10 251 142 11 21 24 43 122 128 230
R.I. 8 5 121 53 2 4 - 2 31 16 41
Conn. 8 5 911 491 18 14 10 48 65 62 255
MID. ATLANTIC 121 78 2,142 1,703 143 254 110 220 1,227 1,625 832
Upstate N.Y. 37 21 1,299 629 41 35 18 24 162 214 589
N.Y. City 19 4 10 92 67 161 29 46 770 834 U
N.J. 4 14 350 455 20 43 20 94 295 326 100
Pa. 61 39 483 527 15 15 43 56 U 251 143
E.N. CENTRAL 181 157 46 43 54 85 503 388 537 960 70
Ohio 77 69 40 13 3 10 75 117 5 165 39
Ind. 33 27 5 11 6 7 104 78 68 81 4
Ill. 14 6 - 6 18 37 188 47 292 504 5
Mich. 37 34 1 13 26 20 104 72 172 153 18
Wis. 20 21 U U 1 11 32 74 U 57 4
W.N. CENTRAL 38 30 31 38 47 28 79 95 129 289 432
Minn. 3 1 16 20 24 10 5 14 U 74 74
Iowa 4 7 11 2 5 6 - 3 U 32 91
Mo. 14 4 1 12 10 6 61 54 86 115 19
N. Dak. - 2 - - 2 2 - - 3 5 89
S. Dak. 2 2 - - - - 1 - 14 7 90
Nebr. 12 11 1 1 - 1 4 1 8 12 3
Kans. 3 3 2 3 6 3 8 23 18 44 66
S. ATLANTIC 75 60 308 278 143 129 1,589 1,810 1,066 1,742 1,138
Del. 8 7 7 59 1 2 15 15 - 17 17
Md. 17 12 211 171 45 43 382 501 149 158 282
D.C. 5 3 4 7 10 9 43 71 62 57 -
Va. 7 13 27 11 26 34 89 147 144 165 351
W. Va. N N 6 1 - - 2 3 24 29 46
N.C. 6 7 19 15 12 7 418 392 216 217 136
S.C. 5 2 3 1 4 9 170 218 171 194 86
Ga. 2 - 2 1 15 15 349 298 230 310 106
Fla. 24 16 29 12 30 10 121 165 70 595 114
E.S. CENTRAL 28 30 40 44 16 16 588 985 359 679 137
Ky. 15 7 8 8 2 4 63 85 - 100 21
Tenn. 10 16 21 18 10 4 303 416 197 248 84
Ala. 3 2 11 4 4 5 143 252 162 215 32
Miss. U 5 U 14 U 3 79 232 U 116 U
W.S. CENTRAL 17 7 10 30 18 9 493 668 62 1,365 108
Ark. - 1 5 9 1 2 66 103 62 118 21
La. 2 2 - 2 4 4 177 209 - 102 -
Okla. 6 1 - 5 2 3 32 60 U 118 87
Tex. 9 3 5 14 11 - 218 296 U 1,027 -
MOUNTAIN 34 29 6 6 27 42 121 87 226 296 86
Mont. 1 1 - - - 2 - - 12 6 29
Idaho - 2 1 2 3 - - - 8 7 -
Wyo. 1 1 - 1 - 2 1 - 2 2 42
Colo. 6 9 2 - 7 23 8 5 U 55 1
N. Mex. 2 1 2 - 11 5 12 4 28 25 2
Ariz. 7 7 - 1 5 4 95 68 114 144 9
Utah 16 5 - - 1 2 3 3 33 11 3
Nev. 1 3 1 2 - 4 2 7 29 46 -
PACIFIC 46 27 67 62 126 237 166 219 2,929 2,018 214
Wash. 6 6 2 2 9 9 12 7 120 159 -
Oreg. - - 8 10 11 11 2 5 65 92 1
Calif. 39 20 56 50 104 209 152 205 2,634 1,615 193
Alaska - - 1 - 1 3 - 1 27 47 20
Hawaii 1 1 - - 1 5 - 1 83 105 -
Guam - - - - - - - 3 - 13 -
P.R. - - - - - 3 117 124 46 112 29
V.I. U U U U U U U U U U U
Amer. Samoa U U U U U U U U U U U
C.N.M.I. - - - - - - 98 9 54 2 -
-------------------------------------------------------------------------------------------------------------------------------------------
N: Not notifiable U: Unavailable -: no reported cases
* Additional information about areas displaying 'U' for cumulative Tuberculosis cases can be found in Notices to Readers, MMWR Vol. 47, No. 2, p. 39.
=======================================================================================================================================================
Return to top. Table_III Note: To print large tables and graphs users may have to change their printer settings to landscape and use a small font size.
TABLE III. (page 1) Provisional cases of selected notifiable diseases preventable by vaccination, United
States, weeks ending July 18, 1998, and July 12, 1997 (28th Week)
Hepatitis (Viral), by type Measles (Rubeola)
H. influenzae, --------------------------------------- ------------------------------------------------------------
invasive A B Indigenous Imported** Total
---------------- ----------------- ----------------- --------------- --------------- ---------------
Cum. Cum. Cum. Cum. Cum. Cum. Cum. Cum. Cum. Cum.
Reporting Area 1998* 1997 1998 1997 1998 1997 1998 1998 1998 1998 1998 1997
-----------------------------------------------------------------------------------------------------------------------------------------------------
UNITED STATES 610 653 11,696 14,778 4,312 4,946 - 26 1 14 40 84
NEW ENGLAND 33 36 146 366 75 91 - 1 1 2 3 12
Maine 2 3 13 42 2 6 - - - - - -
N.H. 5 5 8 19 10 5 - - - - - 1
Vt. 2 3 13 7 1 5 - - 1 1 1 -
Mass. 22 22 44 162 19 39 - 1 - 1 2 10
R.I. 2 2 9 65 43 9 - - - - - -
Conn. - 1 59 71 - 27 - - - - - 1
MID. ATLANTIC 84 89 744 1,214 610 705 - 9 - 2 11 20
Upstate N.Y. 35 24 185 171 172 133 - 2 - - 2 5
N.Y. City 16 23 194 546 157 277 - - - - - 7
N.J. 28 28 161 185 105 134 U 7 U 1 8 3
Pa. 5 14 204 312 176 161 U - U 1 1 5
E.N. CENTRAL 95 108 1,502 1,564 438 831 - 11 - 3 14 8
Ohio 35 59 191 207 42 47 - - - 1 1 -
Ind. 27 10 94 159 49 60 - 2 - 1 3 -
Ill. 29 25 261 403 89 163 - - - - - 6
Mich. - 14 854 679 242 242 - 9 - 1 10 2
Wis. 4 - 102 116 16 319 - - - - - -
W.N. CENTRAL 59 31 933 1,100 238 276 - - - - - 11
Minn. 45 22 78 100 21 23 - - - - - 2
Iowa 1 3 376 184 36 21 - - - - - -
Mo. 8 3 379 587 149 201 - - - - - 1
N. Dak. - - 3 10 4 3 - - - - - -
S. Dak. - 2 17 14 1 - - - - - - 8
Nebr. - 1 16 43 7 8 - - - - - -
Kans. 5 - 64 162 20 20 - - - - - -
S. ATLANTIC 129 104 1,002 793 626 584 - 2 - 5 7 6
Del. - - 2 16 - 4 - - - 1 1 -
Md. 41 44 185 122 94 93 - - - 1 1 1
D.C. - - 30 14 6 22 - - - - - 1
Va. 13 7 137 105 56 72 - - - 2 2 1
W. Va. 4 3 1 6 3 9 U - U - - -
N.C. 18 17 59 108 115 134 - - - - - 1
S.C. 4 3 17 67 16 60 - - - - - -
Ga. 24 21 264 189 96 57 - - - 1 1 -
Fla. 25 9 307 166 240 133 - 2 - - 2 2
E.S. CENTRAL 36 37 203 358 208 373 - - - - - 1
Ky. 4 4 13 46 23 24 - - - - - -
Tenn. 24 23 142 218 152 249 - - - - - -
Ala. 8 8 48 55 33 41 - - - - - 1
Miss. U 2 U 39 U 59 U U U U U -
W.S. CENTRAL 34 29 2,198 3,038 711 616 - - - - - 4
Ark. - 2 53 131 48 45 - - - - - -
La. 16 6 44 116 54 80 - - - - - -
Okla. 16 19 317 894 45 21 - - - - - -
Tex. 2 2 1,784 1,897 564 470 - - - - - 4
MOUNTAIN 68 69 1,845 2,230 469 471 - - - - - 7
Mont. - - 63 51 3 5 - - - - - -
Idaho - 1 149 81 18 15 - - - - - -
Wyo. 1 1 24 20 2 14 - - - - - -
Colo. 14 10 146 242 59 88 - - - - - -
N. Mex. 5 7 87 178 200 155 - - - - - -
Ariz. 38 26 1,185 1,077 121 107 - - - - - 5
Utah 4 3 122 350 41 55 - - - - - -
Nev. 6 21 69 231 25 32 U - U - - 2
PACIFIC 72 150 3,123 4,115 937 999 - 3 - 2 5 15
Wash. 4 2 601 295 66 43 - - - 1 1 -
Oreg. 30 24 214 211 62 60 - - - - - -
Calif. 30 117 2,271 3,508 798 877 - 3 - 1 4 11
Alaska 1 1 14 23 6 11 - - - - - -
Hawaii 7 6 23 78 5 8 U - U - - 4
Guam - - - - - 3 U - U - - -
P.R. 2 - 25 184 252 416 - - - - - -
V.I. U U U U U U U U U U U U
Amer. Samoa U U U U U U U U U U U U
C.N.M.I. - 6 1 1 28 31 U - U - - 1
-----------------------------------------------------------------------------------------------------------------------------------------------------
N: Not notifiable U: Unavailable -: no reported cases
* Of 140 cases among children aged <5 years, serotype was reported for 78 and of those, 32 were type b.
** For imported measles, cases include only those resulting from importation from other countries.
=======================================================================================================================================================
TABLE III. (page 2) Provisional cases of selected notifiable diseases preventable by vaccination, United
States, weeks ending July 18, 1998, and July 12, 1997 (28th Week)
Meningococcal
Disease Mumps Pertussis Rubella
----------------- -------------------------- --------------------------- ---------------------------
Cum. Cum. Cum. Cum. Cum. Cum. Cum. Cum.
Reporting Area 1998 1997 1998 1998 1997 1998 1998 1997 1998 1998 1997
------------------------------------------------------------------------------------------------------------------------------------------
UNITED STATES 1,617 2,099 6 260 367 66 2,382 2,828 4 283 92
NEW ENGLAND 72 129 - 1 7 8 418 576 1 36 1
Maine 5 13 - - - - 5 6 - - -
N.H. 4 12 - - - - 39 67 - - -
Vt. 1 2 - - - 3 41 177 - - -
Mass. 34 67 - 1 2 3 312 303 - 6 1
R.I. 3 9 - - 4 2 5 12 1 1 -
Conn. 25 26 - - 1 - 16 11 - 29 -
MID. ATLANTIC 148 216 - 16 43 2 288 222 3 118 28
Upstate N.Y. 38 59 - 3 9 2 146 82 1 107 5
N.Y. City 17 38 - 4 3 - 8 53 2 6 23
N.J. 40 43 U 1 7 U 5 11 U 4 -
Pa. 53 76 U 8 24 U 129 76 U 1 -
E.N. CENTRAL 246 313 - 43 44 6 211 266 - - 5
Ohio 88 114 - 19 17 3 76 78 - - -
Ind. 46 34 - 5 4 2 68 30 - - -
Ill. 60 90 - 2 8 1 16 35 - - 1
Mich. 28 47 - 17 12 - 34 31 - - -
Wis. 24 28 - - 3 - 17 92 - - 4
W.N. CENTRAL 136 153 - 20 12 1 190 163 - 26 -
Minn. 24 25 - 10 5 - 115 101 - - -
Iowa 23 34 - 6 6 - 40 9 - - -
Mo. 52 69 - 3 - 1 16 29 - 2 -
N. Dak. 2 1 - 1 - - - 1 - - -
S. Dak. 6 4 - - - - 5 3 - - -
Nebr. 5 6 - - 1 - 5 4 - - -
Kans. 24 14 - - - - 9 16 - 24 -
S. ATLANTIC 287 355 2 37 41 8 145 252 - 8 29
Del. 1 5 - - - - 2 - - - -
Md. 23 35 - - 1 1 29 80 - - -
D.C. - 5 - - - - 1 3 - - -
Va. 23 35 - 5 6 1 7 31 - - 1
W. Va. 9 14 U - - U 1 5 U - -
N.C. 42 66 - 9 7 2 50 68 - 5 22
S.C. 41 38 - 4 10 1 16 11 - - 6
Ga. 62 66 - 1 5 - 6 6 - - -
Fla. 86 91 2 18 12 3 33 48 - 3 -
E.S. CENTRAL 113 154 - 1 19 2 56 56 - - 1
Ky. 17 38 - - 3 2 22 14 - - -
Tenn. 43 53 - 1 3 - 18 21 - - -
Ala. 53 46 - - 6 - 16 15 - - 1
Miss. U 17 U U 7 U U 6 U U -
W.S. CENTRAL 187 195 1 40 44 15 181 98 - 77 3
Ark. 23 25 - - 1 2 26 7 - - -
La. 38 41 - 8 11 - 2 12 - - -
Okla. 29 23 - - - 5 18 13 - - -
Tex. 97 106 1 32 32 8 135 66 - 77 3
MOUNTAIN 90 122 - 23 47 21 530 713 - 5 5
Mont. 3 7 - - - 1 3 8 - - -
Idaho 4 8 - 3 2 - 194 444 - - 1
Wyo. 4 1 - 1 1 - 7 5 - - -
Colo. 19 32 - 5 3 3 105 186 - - -
N. Mex. 16 19 N N N 1 67 36 - 1 -
Ariz. 31 31 - 5 30 16 114 20 - 1 4
Utah 10 11 - 3 6 - 28 4 - 2 -
Nev. 3 13 U 6 5 U 12 10 U 1 -
PACIFIC 338 462 3 79 110 3 363 482 - 13 20
Wash. 45 55 - 5 13 - 149 207 - 9 5
Oreg. 55 92 N N N 3 26 22 - - -
Calif. 233 312 3 59 80 - 182 236 - 2 8
Alaska 1 1 - 2 5 - 2 4 - - -
Hawaii 4 2 U 13 12 U 4 13 U 2 7
Guam - 1 U - 1 U - - U - -
P.R. 5 8 - 1 5 - 2 - - - -
V.I. U U U U U U U U U U U
Amer. Samoa U U U U U U U U U U U
C.N.M.I. - - U 2 4 U 1 - U - -
------------------------------------------------------------------------------------------------------------------------------------------
N: Not notifiable U: Unavailable -: no reported cases
=======================================================================================================================================================
Return to top. Table_IV Note: To print large tables and graphs users may have to change their printer settings to landscape and use a small font size.
TABLE IV. Deaths in 122 U.S. cities,* week ending
July 18, 1998 (28th Week)
===================================================================================================================================
All Causes, By Age (Years)
------------------------------------------------------------------------ P&I**
Reporting Area All Ages >=65 45-64 25-44 1-24 <1 Total
---------------------------------------------------------------------------------------------------------------
NEW ENGLAND 553 368 104 59 10 12 31
Boston, Mass. 133 91 23 17 - 2 11
Bridgeport, Conn. 45 30 10 3 1 1 1
Cambridge, Mass. 21 17 3 - - 1 2
Fall River, Mass. 26 21 5 - - - -
Hartford, Conn. 55 27 13 10 3 2 -
Lowell, Mass. 19 15 2 2 - - 2
Lynn, Mass. 11 7 4 - - - -
New Bedford, Mass. 26 25 - 1 - - -
New Haven, Conn. 33 15 8 6 4 - 2
Providence, R.I. 59 35 11 7 2 4 -
Somerville, Mass. 4 3 1 - - - -
Springfield, Mass. 44 28 8 7 - 1 7
Waterbury, Conn. 27 19 5 2 - 1 2
Worcester, Mass. 50 35 11 4 - - 4
MID. ATLANTIC 2,093 1,411 415 178 52 37 116
Albany, N.Y. 31 21 7 1 2 - -
Allentown, Pa. 17 9 5 2 1 - -
Buffalo, N.Y. 98 68 15 10 2 3 10
Camden, N.J. 24 15 6 3 - - 4
Elizabeth, N.J. 17 13 2 2 - - 1
Erie, Pa. 28 21 5 1 - 1 1
Jersey City, N.J. 30 16 6 6 1 1 -
New York City, N.Y. 1,129 774 231 95 19 10 54
Newark, N.J. 55 23 11 11 3 7 5
Paterson, N.J. 28 19 3 1 - 5 -
Philadelphia, Pa. 300 178 72 33 11 6 17
Pittsburgh, Pa.*** 37 31 4 - 2 - 2
Reading, Pa. 26 20 4 - 2 - 2
Rochester, N.Y. 102 72 18 6 4 2 9
Schenectady, N.Y. 16 13 3 - - - 1
Scranton, Pa. 24 20 3 1 - - -
Syracuse, N.Y. 96 70 15 4 5 2 7
Trenton, N.J. 19 15 2 2 - - 3
Utica, N.Y. 16 13 3 - - - -
Yonkers, N.Y. U U U U U U U
E.N. CENTRAL 2,070 1,386 393 160 61 54 94
Akron, Ohio 44 28 8 3 2 3 -
Canton, Ohio 39 27 9 3 - - 5
Chicago, Ill. 415 258 83 43 13 16 25
Cincinnati, Ohio 76 52 15 3 5 1 6
Cleveland, Ohio 175 108 46 15 3 3 2
Columbus, Ohio 167 113 33 10 5 6 13
Dayton, Ohio 122 95 18 7 - 2 9
Detroit, Mich. 196 107 49 22 12 6 6
Evansville, Ind. 54 42 11 1 - - 2
Fort Wayne, Ind. 57 40 2 - - 1 4
Gary, Ind. 10 5 1 2 2 - -
Grand Rapids, Mich. 69 50 9 9 1 - 7
Indianapolis, Ind. 183 123 33 15 5 7 -
Lansing, Mich. 40 33 5 2 - - 1
Milwaukee, Wis. 118 78 27 9 1 3 6
Peoria, Ill. 48 42 3 3 - - 1
Rockford, Ill. 51 33 13 2 2 1 2
South Bend, Ind. 61 41 10 2 6 2 2
Toledo, Ohio 83 63 9 6 4 1 2
Youngstown, Ohio 62 48 9 3 - 2 1
W.N. CENTRAL 734 501 123 52 28 21 35
Des Moines, Iowa U U U U U U U
Duluth, Minn. 37 28 7 - 1 1 1
Kansas City, Kans. 34 23 5 5 - 1 -
Kansas City, Mo. 83 54 14 3 1 2 2
Lincoln, Nebr. 51 35 12 3 - 1 6
Minneapolis, Minn. 112 85 17 5 1 4 7
Omaha, Nebr. 101 66 17 9 4 5 11
St. Louis, Mo. 115 69 26 11 8 1 -
St. Paul, Minn. 95 69 12 6 6 2 5
Wichita, Kans. 106 72 13 10 7 4 3
S. ATLANTIC 1,130 729 216 117 35 28 61
Atlanta, Ga. U U U U U U U
Baltimore, Md. 162 97 30 28 6 1 15
Charlotte, N.C. 109 68 26 14 - 1 6
Jacksonville, Fla. 156 103 31 16 1 4 3
Miami, Fla. 133 84 26 18 4 1 -
Norfolk, Va. 59 39 11 4 3 2 4
Richmond, Va. 61 40 9 5 3 4 1
Savannah, Ga. 54 41 10 3 - - 9
St. Petersburg, Fla. 63 52 5 2 2 2 5
Tampa, Fla. 170 112 31 12 8 3 11
Washington, D.C. 151 90 31 12 8 10 7
Wilmington, Del. 12 3 6 3 - - -
E.S. CENTRAL 843 582 165 54 31 9 54
Birmingham, Ala. 186 132 32 10 8 2 10
Chattanooga, Tenn. 70 48 16 4 1 1 6
Knoxville, Tenn. 99 63 26 7 3 - 7
Lexington, Ky. 79 53 13 10 3 - 8
Memphis, Tenn. 186 130 36 7 10 3 15
Mobile, Ala. 84 60 15 7 2 - 2
Montgomery, Ala. 38 26 6 4 1 1 2
Nashville, Tenn. 101 70 21 5 3 2 4
W.S. CENTRAL 1,462 929 311 135 48 38 69
Austin, Tex. 82 55 20 4 1 2 3
Baton Rouge, La. 53 32 11 7 3 - 3
Corpus Christi, Tex. 54 41 7 4 2 - 4
Dallas, Tex. 207 126 43 22 12 4 3
El Paso, Tex. 74 48 17 4 - 5 1
Ft. Worth, Tex. 87 59 19 4 1 4 5
Houston, Tex. 361 218 80 42 14 7 20
Little Rock, Ark. 76 42 16 9 5 4 5
New Orleans, La. 99 52 28 11 6 2 -
San Antonio, Tex. 212 148 40 14 1 8 12
Shreveport, La. 52 34 11 5 1 1 4
Tulsa, Okla. 105 74 19 9 2 1 9
MOUNTAIN 887 595 163 75 29 25 43
Albuquerque, N.M. 109 72 16 13 3 5 3
Boise, Idaho 33 25 6 - 1 1 -
Colo. Springs, Colo. 54 34 14 2 3 1 1
Denver, Colo. 114 70 27 8 5 4 9
Las Vegas, Nev. 220 152 38 21 6 3 7
Ogden, Utah 31 19 6 5 1 - 3
Phoenix, Ariz. 68 52 8 5 2 1 1
Pueblo, Colo. 18 11 3 3 1 - 1
Salt Lake City, Utah 86 60 14 5 4 3 5
Tucson, Ariz. 154 100 31 13 3 7 13
PACIFIC 1,865 1,319 340 138 35 32 150
Berkeley, Calif. 21 15 6 - - - -
Fresno, Calif. 111 84 12 9 3 3 11
Glendale, Calif. 39 33 3 2 - 1 3
Honolulu, Hawaii 66 52 8 4 1 1 4
Long Beach, Calif. 49 33 13 2 - 1 4
Los Angeles, Calif. 651 444 122 56 20 9 36
Pasadena, Calif. 30 23 6 - - 1 1
Portland, Oreg. U U U U U U U
Sacramento, Calif. 208 151 31 17 4 5 29
San Diego, Calif. 161 114 30 13 - 3 16
San Francisco, Calif. 121 78 25 14 1 3 12
San Jose, Calif. 164 117 33 11 1 2 21
Santa Cruz, Calif. 41 33 7 1 - - 4
Seattle, Wash. 150 102 32 8 5 3 6
Spokane, Wash. 53 40 12 1 - - 3
Tacoma, Wash. U U U U U U U
TOTAL 11,637**** 7,820 2,230 968 329 256 653
---------------------------------------------------------------------------------------------------------------
U: Unavailable -: no reported cases
* Mortality data in this table are voluntarily reported from 122 cities in the United States, most of which have populations
of 100,000 or more. A death is reported by the place of its occurrence and by the week that the death certificate was
filed. Fetal deaths are not included.
** Pneumonia and influenza.
*** Because of changes in reporting methods in this Pennsylvania city, these numbers are partial counts for the current
week. Complete counts will be available in 4 to 6 weeks.
**** Total includes unknown ages.
===================================================================================================================================
Return to top. Disclaimer All MMWR HTML versions of articles are electronic conversions from ASCII text into HTML. This conversion may have resulted in character translation or format errors in the HTML version. Users should not rely on this HTML document, but are referred to the electronic PDF version and/or the original MMWR paper copy for the official text, figures, and tables. An original paper copy of this issue can be obtained from the Superintendent of Documents, U.S. Government Printing Office (GPO), Washington, DC 20402-9371; telephone: (202) 512-1800. Contact GPO for current prices. **Questions or messages regarding errors in formatting should be addressed to mmwrq@cdc.gov.Page converted: 10/05/98 |
|||||||||
This page last reviewed 5/2/01
|