Statistics
Textbooks
Boundless Statistics
Statistics Textbooks Boundless Statistics
Statistics Textbooks
Statistics

Chapter 4

Frequency Distributions

Book Version 1
By Boundless
Boundless Statistics
Statistics
by Boundless
View the full table of contents
Section 1
Frequency Distributions for Quantitative Data
Thumbnail
Guidelines for Plotting Frequency Distributions

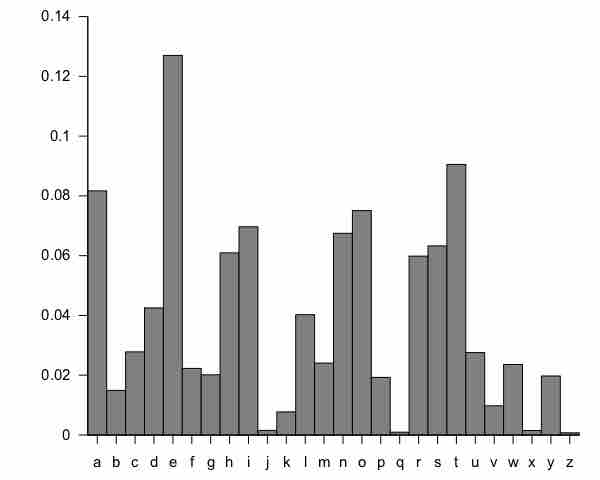
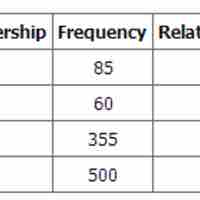
The frequency distribution of events is the number of times each event occurred in an experiment or study.

Thumbnail
Outliers

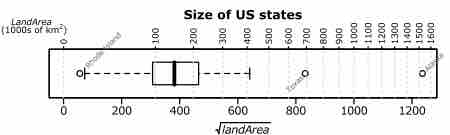
In statistics, an outlier is an observation that is numerically distant from the rest of the data.

Thumbnail
Relative Frequency Distributions

A relative frequency is the fraction or proportion of times a value occurs in a data set.

Thumbnail
Cumulative Frequency Distributions

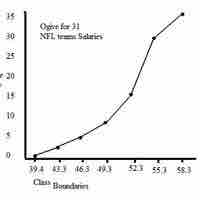
A cumulative frequency distribution displays a running total of all the preceding frequencies in a frequency distribution.

Thumbnail
Graphs for Quantitative Data

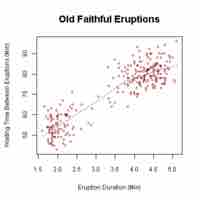
A plot is a graphical technique for representing a data set, usually as a graph showing the relationship between two or more variables.

Thumbnail
Typical Shapes

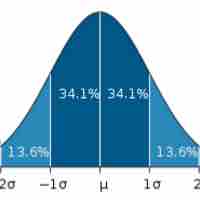
Distributions can be symmetrical or asymmetrical depending on how the data falls.

Thumbnail
Z-Scores and Location in a Distribution

A $z$-score is the signed number of standard deviations an observation is above the mean of a distribution.

Section 2
Frequency Distributions for Qualitative Data
Describing Qualitative Data

Qualitative data is a categorical measurement expressed not in terms of numbers, but rather by means of a natural language description.

Thumbnail
Interpreting Distributions Constructed by Others

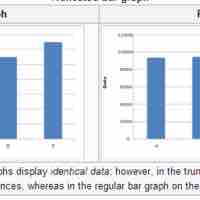
Graphs of distributions created by others can be misleading, either intentionally or unintentionally.

Thumbnail
Graphs of Qualitative Data

Qualitative data can be graphed in various ways, including using pie charts and bar charts.

Thumbnail
Misleading Graphs

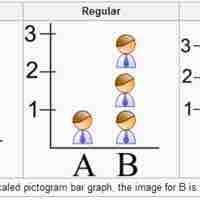
A misleading graph misrepresents data and may result in incorrectly derived conclusions.

Thumbnail
Do It Yourself: Plotting Qualitative Frequency Distributions

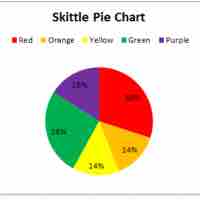
Qualitative frequency distributions can be displayed in bar charts, Pareto charts, and pie charts.

Summation Notation

In statistical formulas that involve summing numbers, the Greek letter sigma is used as the summation notation.

Thumbnail
Graphing Bivariate Relationships

We can learn much more by displaying bivariate data in a graphical form that maintains the pairing of variables.

You are in this book
Boundless Statistics by Boundless
Previous Chapter
Chapter 3
Visualizing Data
  • The Histogram
  • Graphing Data
Current Chapter
Chapter 4
Frequency Distributions
  • Frequency Distributions for Quantitative Data
  • Frequency Distributions for Qualitative Data
Next Chapter
Chapter 5
Describing, Exploring, and Comparing Data
  • Central Tendency
  • Measures of Relative Standing
  • The Law of Averages
  • Further Considerations for Data
Subjects
  • Accounting
  • Algebra
  • Art History
  • Biology
  • Business
  • Calculus
  • Chemistry
  • Communications
  • Economics
  • Finance
  • Management
  • Marketing
  • Microbiology
  • Physics
  • Physiology
  • Political Science
  • Psychology
  • Sociology
  • Statistics
  • U.S. History
  • World History
  • Writing

Except where noted, content and user contributions on this site are licensed under CC BY-SA 4.0 with attribution required.