Statistics
Textbooks
Boundless Statistics
Continuous Random Variables
The Normal Curve
Statistics Textbooks Boundless Statistics Continuous Random Variables The Normal Curve
Statistics Textbooks Boundless Statistics Continuous Random Variables
Statistics Textbooks Boundless Statistics
Statistics Textbooks
Statistics
Concept Version 7
Created by Boundless

Finding the Area Under the Normal Curve

To calculate the probability that a variable is within a range in the normal distribution, we have to find the area under the normal curve.

Learning Objective

  • Interpret a $z$-score table to calculate the probability that a variable is within range in a normal distribution


Key Points

    • To calculate the area under a normal curve, we use a $z$-score table.
    • In a $z$-score table, the left most column tells you how many standard deviations above the the mean to 1 decimal place, the top row gives the second decimal place, and the intersection of a row and column gives the probability.
    • For example, if we want to know the probability that a variable is no more than 0.51 standard deviations above the mean, we find select the 6th row down (corresponding to 0.5) and the 2nd column (corresponding to 0.01).

Term

  • z-score

    The standardized value of observation $x$ from a distribution that has mean $\mu$ and standard deviation $\sigma$.


Full Text

To calculate the probability that a variable is within a range in the normal distribution, we have to find the area under the normal curve. In order to do this, we use a $z$-score table. (Same as in the process of standardization discussed in the previous section).

Areas Under the Normal Curve

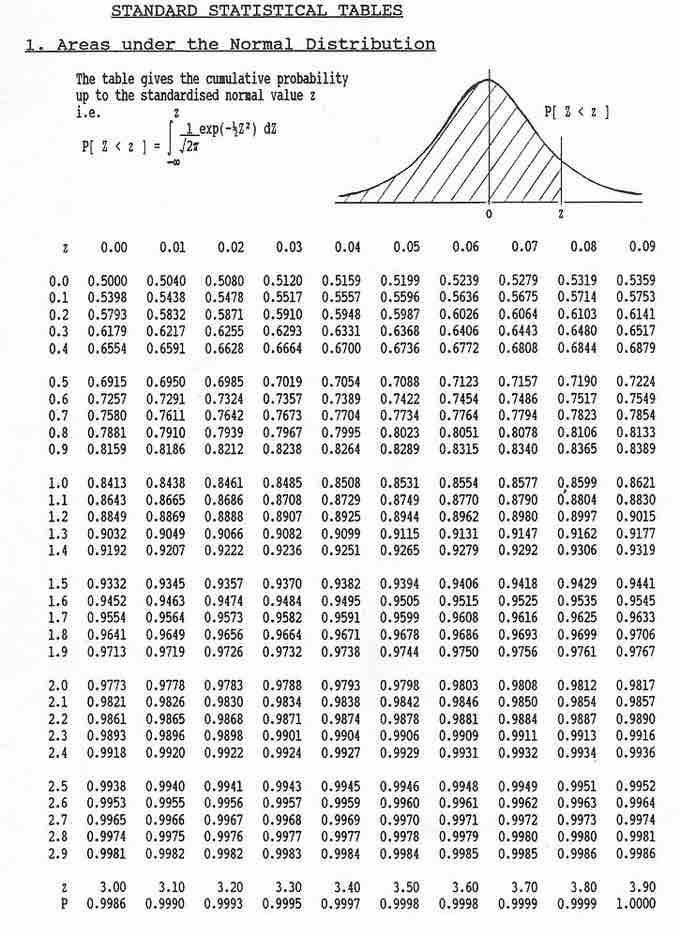
This table gives the cumulative probability up to the standardized normal value $z$.

These tables can seem a bit daunting; however, the key is knowing how to read them.

  • The left most column tells you how many standard deviations above the the mean to 1 decimal place.
  • The top row gives the second decimal place.
  • The intersection of a row and column gives the probability.

For example, if we want to know the probability that a variable is no more than 0.51 standard deviations above the mean, we find select the 6th row down (corresponding to 0.5) and the 2nd column (corresponding to 0.01). The intersection of the 6th row and 2nd column is 0.6950. This tells us that there is a 69.50% percent chance that a variable is less than 0.51 sigmas above the mean.

Notice that for 0.00 standard deviations, the probability is 0.5000. This shows us that there is equal probability of being above or below the mean.

Consider the following as a simple example: find $P(Z\leq 1.5)$.

This problem essentially asks what is the probability that a variable is less than 1.5 standard deviations above the mean. On the table of values, find the row that corresponds to 1.5 and the column that corresponds to 0.00. This gives us a probability of 0.933.

The following is another simple example: find $P(Z\geq 1.17)$.

This problem essentially asks what is the probability that a variable is MORE than 1.17 standard deviation above the mean. On the table of values, find the row that corresponds to 1.1 and the column that corresponds to 0.07. This gives us a probability of 0.8790. However, this is the probability that the value is less than 1.17 sigmas above the mean. Since all the probabilities must sum to 1:

$P(Z>1.17) = 1-P(Z<1.17) = 0.121$

As a final example: find $P(-1.16\leq Z\leq 1.32)$.

This example is a bit tougher. The problem can be rewritten in the form below.

$P(-1.16\leq Z\leq 1.32) = P(Z\leq 1.32) - P(Z\leq -1.16)$

The difficulty arrises from the fact that our table of values does not allow us to directly calculate $P(Z\leq -1.16)$. However, we can use the symmetry of the distribution, as follows:

$P(Z\leq -1.16) = 1-P(Z\leq 1.16) = 0.1230$

So, we can say that:

$P(-1.16\leq Z \leq 1.32) = 0.9066 - 0.1230 = 0.7836$

[ edit ]
Edit this content
Prev Concept
The Standard Normal Curve
The Normal Approximation to the Binomial Distribution
Next Concept
Subjects
  • Accounting
  • Algebra
  • Art History
  • Biology
  • Business
  • Calculus
  • Chemistry
  • Communications
  • Economics
  • Finance
  • Management
  • Marketing
  • Microbiology
  • Physics
  • Physiology
  • Political Science
  • Psychology
  • Sociology
  • Statistics
  • U.S. History
  • World History
  • Writing

Except where noted, content and user contributions on this site are licensed under CC BY-SA 4.0 with attribution required.