Algebra
Textbooks
Boundless Algebra
Functions
Domain and Range
Algebra Textbooks Boundless Algebra Functions Domain and Range
Algebra Textbooks Boundless Algebra Functions
Algebra Textbooks Boundless Algebra
Algebra Textbooks
Algebra
Concept Version 17
Created by Boundless

Visualizing Domain and Range
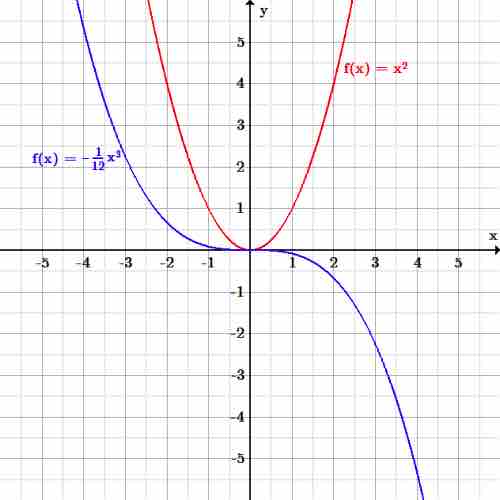
Domain and range graph

Domain and range graph

The graph of $f(x)=x^2$ (red) has the same domain (input values) as the graph of $f(x)=-\frac{1}{12}x^3$ (blue) since all real numbers can be input values.  However, the range of the red graph is restricted to only $f(x)\geq0$, or $y$-values above or equal to $0$.  The range of the blue graph is all real numbers, $\mathbb{R}$.

Source

    Boundless vets and curates high-quality, openly licensed content from around the Internet. This particular resource used the following sources:

    "Original figure by Julien Coyne. Licensed CC BY-SA 4.0."
    Julien Coyne CC BY-SA 3.0.

Related Terms

  • range
  • domain
  • function
  • Subjects
    • Accounting
    • Algebra
    • Art History
    • Biology
    • Business
    • Calculus
    • Chemistry
    • Communications
    • Economics
    • Finance
    • Management
    • Marketing
    • Microbiology
    • Physics
    • Physiology
    • Political Science
    • Psychology
    • Sociology
    • Statistics
    • U.S. History
    • World History
    • Writing

    Except where noted, content and user contributions on this site are licensed under CC BY-SA 4.0 with attribution required.