Exploratory data analysis (EDA) is an approach to analyzing data sets in order to summarize their main characteristics, often with visual methods. It is a statistical practice concerned with (among other things):
- uncovering underlying structure,
- extracting important variables,
- detecting outliers and anomalies,
- testing underlying assumptions, and
- developing models.
Primarily, EDA is for seeing what the data can tell us beyond the formal modeling or hypothesis testing task. EDA is different from initial data analysis (IDA), which focuses more narrowly on checking assumptions required for model fitting and hypothesis testing, handling missing values, and making transformations of variables as needed. EDA encompasses IDA.
Exploratory data analysis was promoted by John Tukey to encourage statisticians to explore the data and possibly formulate hypotheses that could lead to new data collection and experiments. Tukey's EDA was related to two other developments in statistical theory: robust statistics and nonparametric statistics. Both of these try to reduce the sensitivity of statistical inferences to errors in formulating statistical models. Tukey promoted the use of the five number summary of numerical data:
His reasoning was that the median and quartiles, being functions of the empirical distribution, are defined for all distributions, unlike the mean and standard deviation. Moreover, the quartiles and median are more robust to skewed or heavy-tailed distributions than traditional summaries (the mean and standard deviation).
Exploratory data analysis, robust statistics, and nonparametric statistics facilitated statisticians' work on scientific and engineering problems. Such problems included the fabrication of semiconductors and the understanding of communications networks. These statistical developments, all championed by Tukey, were designed to complement the analytic theory of testing statistical hypotheses.
Objectives of EDA
Tukey held that too much emphasis in statistics was placed on statistical hypothesis testing (confirmatory data analysis) and more emphasis needed to be placed on using data to suggest hypotheses to test. In particular, he held that confusing the two types of analyses and employing them on the same set of data can lead to systematic bias owing to the issues inherent in testing hypotheses suggested by the data.
Subsequently, the objectives of EDA are to:
- suggest hypotheses about the causes of observed phenomena,
- assess assumptions on which statistical inference will be based,
- support the selection of appropriate statistical tools and techniques, and
- provide a basis for further data collection through surveys or experiments.
Techniques of EDA
Although EDA is characterized more by the attitude taken than by particular techniques, there are a number of tools that are useful. Many EDA techniques have been adopted into data mining and are being taught to young students as a way to introduce them to statistical thinking. Typical graphical techniques used in EDA are:
- Box plots
- Histograms
- Multi-vari charts
- Run charts
- Pareto charts
- Scatter plots
- Stem-and-leaf plots
- Parallel coordinates
- Odds ratios
- Multidimensional scaling
- Targeted projection pursuits
- Principal component analyses
- Parallel coordinate plots
- Interactive versions of these plots
- Projection methods such as grand tour, guided tour and manual tour
These EDA techniques aim to position these plots so as to maximize our natural pattern-recognition abilities. A clear picture is worth a thousand words!
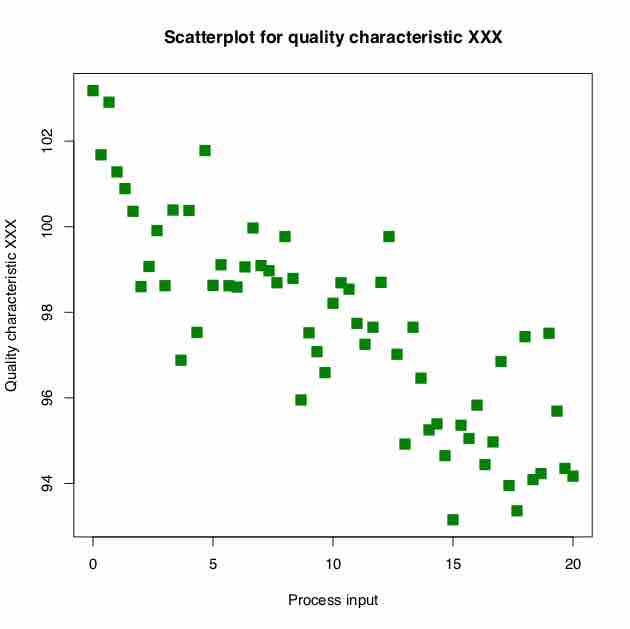
Scatter Plots
A scatter plot is one visual statistical technique developed from EDA.