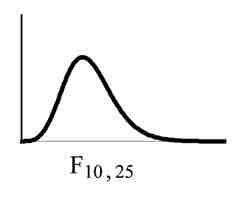
Statistics
Textbooks
Boundless Statistics
Estimation and Hypothesis Testing
One-Way ANOVA
Statistics Textbooks Boundless Statistics Estimation and Hypothesis Testing One-Way ANOVA
Statistics Textbooks Boundless Statistics Estimation and Hypothesis Testing
Statistics Textbooks Boundless Statistics
Statistics Textbooks
Statistics
Concept Version 8
Created by Boundless

Mean Squares and the F-Ratio

Most $F$-tests arise by considering a decomposition of the variability in a collection of data in terms of sums of squares.

Learning Objective

  • Demonstrate how sums of squares and mean squares produce the $F$-ratio and the implications that changes in mean squares have on it.


Key Points

    • The test statistic in an $F$-test is the ratio of two scaled sums of squares reflecting different sources of variability.
    • These sums of squares are constructed so that the statistic tends to be greater when the null hypothesis is not true.
    • To calculate the $F$-ratio, two estimates of the variance are made: variance between samples and variance within samples.
    • The one-way ANOVA test depends on the fact that the mean squares between samples can be influenced by population differences among means of the several groups.

Terms

  • null hypothesis

    A hypothesis set up to be refuted in order to support an alternative hypothesis; presumed true until statistical evidence in the form of a hypothesis test indicates otherwise.

  • pooled variance

    A method for estimating variance given several different samples taken in different circumstances where the mean may vary between samples but the true variance is assumed to remain the same.


Full Text

Most $F$-tests arise by considering a decomposition of the variability in a collection of data in terms of sums of squares. The test statistic in an $F$-test is the ratio of two scaled sums of squares reflecting different sources of variability. These sums of squares are constructed so that the statistic tends to be greater when the null hypothesis is not true. In order for the statistic to follow the $F$-distribution under the null hypothesis, the sums of squares should be statistically independent, and each should follow a scaled chi-squared distribution. The latter condition is guaranteed if the data values are independent and normally distributed with a common variance .

$F$-Distribution

The $F$ ratio follows the $F$-distribution, which is right skewed.

There are two sets of degrees of freedom for the $F$-ratio: one for the numerator and one for the denominator. For example, if $F$ follows an $F$-distribution and the degrees of freedom for the numerator are 4 and the degrees of freedom for the denominator are 10, then $F \sim F_{4, 10}$.

To calculate the $F$-ratio, two estimates of the variance are made:

  1. Variance between samples: An estimate of $\sigma^2$ that is the variance of the sample means multiplied by $n$ (when there is equal $n$). If the samples are different sizes, the variance between samples is weighted to account for the different sample sizes. The variance is also called variation due to treatment or explained variation.
  2. Variance within samples: An estimate of $\sigma^2$ that is the average of the sample variances (also known as a pooled variance). When the sample sizes are different, the variance within samples is weighted. The variance is also called the variation due to error or unexplained variation.
  • $SS_{\text{between}}$ is the sum of squares that represents the variation among the different samples.
  • $SS_{\text{within}}$ is the sum of squares that represents the variation within samples that is due to chance.

To find a "sum of squares" is to add together squared quantities which, in some cases, may be weighted. $MS$ means "mean square. " $MS_{\text{between}}$ is the variance between groups and $MS_{\text{within}}$ is the variance within groups.

Calculation of Sum of Squares and Mean Square

  • $k$ is the number of different groups
  • $n_j$ is the size of the $j$th group
  • $s_j$ is the sum of the values in the $j$th group
  • $n$ is total number of all the values combined. (Total sample size: $\sum_j n_j$)
  • $x$ is one value: $\sum x = \sum_j s_j$
  • Sum of squares of all values from every group combined: $\sum x^2$
  • Between group variability: $\displaystyle { SS }_{ \text{total} }=\sum { { x }^{ 2 }- } \frac { { \left( \sum { x } \right) }^{ 2 } }{ n }$
  • Total sum of squares: $\displaystyle \sum { { x }^{ 2 }- } \frac { { \left( \sum { x } \right) }^{ 2 } }{ n }$
  • Explained variation: sum of squares representing variation among the different samples $\displaystyle { SS }_{ \text{between} }=\sum { \left[ \frac { { \left( s_j \right) }^{ 2 } }{ { n }_{ j } } \right] - } \frac { { \left( \sum { { s }_{ j } } \right) }^{ 2 } }{ n }$
  • Unexplained variation: sum of squares representing variation within samples due to chance: $SS_{\text{within}} = SS_{\text{total}} = SS_{\text{between}}$
  • $df$'s for different groups ($df$'s for the numerator): $df_{\text{between}} = k-1$
  • Equation for errors within samples ($df$'s for the denominator): $df_{\text{within}} = n-k$
  • Mean square (variance estimate) explained by the different groups: $\displaystyle { MS }_{ \text{between} }=\frac { { SS }_{ \text{between} } }{ { df }_{ \text{between} } }$
  • Mean square (variance estimate) that is due to chance (unexplained): $\displaystyle{ MS }_{ \text{within} }=\frac { { SS }_{ \text{within} } }{ { df }_{ \text{within} } }$

MSbetween and MSwithin can be written as follows:

  • $\displaystyle { MS }_{ \text{between} }=\frac { { SS }_{ \text{between} } }{ { df }_{ \text{between} } } =\frac { { SS }_{ \text{between} } }{ k-1 }$
  • $\displaystyle { MS }_{ \text{within} }=\frac { { SS }_{ \text{within} } }{ { df }_{ \text{within} } } =\frac { { SS }_{ \text{within} } }{ n-k }$

The one-way ANOVA test depends on the fact that $MS_{\text{between}}$ can be influenced by population differences among means of the several groups. Since $MS_{\text{within}}$ compares values of each group to its own group mean, the fact that group means might be different does not affect $MS_{\text{within}}$.

The null hypothesis says that all groups are samples from populations having the same normal distribution. The alternate hypothesis says that at least two of the sample groups come from populations with different normal distributions. If the null hypothesis is true, $MS_{\text{between}}$ and $MS_{\text{within}}$ should both estimate the same value. Note that the null hypothesis says that all the group population means are equal. The hypothesis of equal means implies that the populations have the same normal distribution because it is assumed that the populations are normal and that they have equal variances.

F Ratio

$\displaystyle F=\frac { { MS }_{ \text{between} } }{ { MS }_{ \text{within} } }$

If $MS_{\text{between}}$ and $MS_{\text{within}}$ estimate the same value (following the belief that Ho is true), then the F-ratio should be approximately equal to one. Mostly just sampling errors would contribute to variations away from one. As it turns out, $MS_{\text{between}}$ consists of the population variance plus a variance produced from the differences between the samples. $MS_{\text{within}}$ is an estimate of the population variance. Since variances are always positive, if the null hypothesis is false, $MS_{\text{between}}$ will generally be larger than $MS_{\text{within}}$. Then, the F-ratio will be larger than one. However, if the population effect size is small it is not unlikely that $MS_{\text{within}}$ will be larger in a give sample.

[ edit ]
Edit this content
Prev Concept
Variance Estimates
ANOVA
Next Concept
Subjects
  • Accounting
  • Algebra
  • Art History
  • Biology
  • Business
  • Calculus
  • Chemistry
  • Communications
  • Economics
  • Finance
  • Management
  • Marketing
  • Microbiology
  • Physics
  • Physiology
  • Political Science
  • Psychology
  • Sociology
  • Statistics
  • U.S. History
  • World History
  • Writing

Except where noted, content and user contributions on this site are licensed under CC BY-SA 4.0 with attribution required.