If confidence intervals are constructed across many separate data analyses of repeated (and possibly different) experiments, the proportion of such intervals that contain the true value of the parameter will match the confidence level. This is guaranteed by the reasoning underlying the construction of confidence intervals.
Confidence intervals consist of a range of values (interval) that act as good estimates of the unknown population parameter . However, in infrequent cases, none of these values may cover the value of the parameter. The level of confidence of the confidence interval would indicate the probability that the confidence range captures this true population parameter given a distribution of samples. It does not describe any single sample. This value is represented by a percentage, so when we say, "we are 99% confident that the true value of the parameter is in our confidence interval," we express that 99% of the observed confidence intervals will hold the true value of the parameter.
Confidence Level
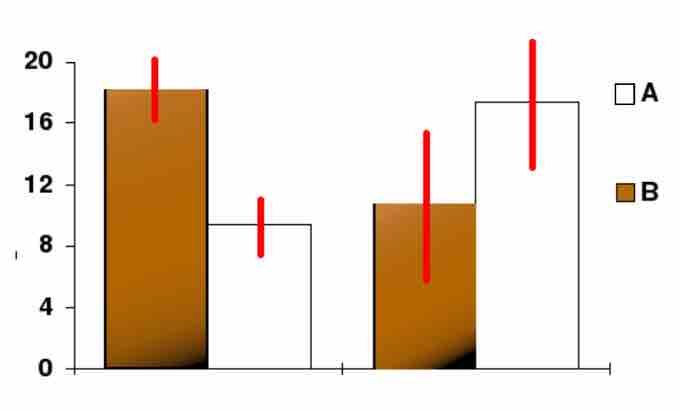
In this bar chart, the top ends of the bars indicate observation means and the red line segments represent the confidence intervals surrounding them. Although the bars are shown as symmetric in this chart, they do not have to be symmetric.
After a sample is taken, the population parameter is either in the interval made or not -- there is no chance. The desired level of confidence is set by the researcher (not determined by data). If a corresponding hypothesis test is performed, the confidence level is the complement of respective level of significance (i.e., a 95% confidence interval reflects a significance level of 0.05).
In applied practice, confidence intervals are typically stated at the 95% confidence level. However, when presented graphically, confidence intervals can be shown at several confidence levels (for example, 50%, 95% and 99%).