Statistics
Textbooks
Boundless Statistics
Describing, Exploring, and Comparing Data
Central Tendency
Statistics Textbooks Boundless Statistics Describing, Exploring, and Comparing Data Central Tendency
Statistics Textbooks Boundless Statistics Describing, Exploring, and Comparing Data
Statistics Textbooks Boundless Statistics
Statistics Textbooks
Statistics
Concept Version 9
Created by Boundless

Which Average: Mean, Mode, or Median?

Depending on the characteristic distribution of a data set, the mean, median or mode may be the more appropriate metric for understanding.

Learning Objective

  • Assess various situations and determine whether the mean, median, or mode would be the appropriate measure of central tendency.


Key Points

    • In symmetrical, unimodal distributions, such as the normal distribution (the distribution whose density function, when graphed, gives the famous "bell curve"), the mean (if defined), median and mode all coincide.
    • If elements in a sample data set increase arithmetically, when placed in some order, then the median and arithmetic mean are equal. For example, consider the data sample $\{1, 2, 3, 4\}$. The mean is 2.5, as is the median.
    • While the arithmetic mean is often used to report central tendencies, it is not a robust statistic, meaning that it is greatly influenced by outliers (values that are very much larger or smaller than most of the values).
    • The median is of central importance in robust statistics, as it is the most resistant statistic, having a breakdown point of 50%: so long as no more than half the data is contaminated, the median will not give an arbitrarily large result.
    • Unlike mean and median, the concept of mode also makes sense for "nominal data" (i.e., not consisting of numerical values in the case of mean, or even of ordered values in the case of median).

Terms

  • Mode

    the most frequently occurring value in a distribution

  • breakdown point

    the number or proportion of arbitrarily large or small extreme values that must be introduced into a batch or sample to cause the estimator to yield an arbitrarily large result

  • median

    the numerical value separating the higher half of a data sample, a population, or a probability distribution, from the lower half


Example

    • The mode is the value that appears most often in a set of data. For example, the mode of the sample $[1, 3, 6, 6, 6, 6, 7, 7, 12, 12, 17]$ is 6. The median of a finite list of numbers can be found by arranging all the observations from lowest value to highest value and picking the middle one (e.g., the median of $\{3, 5, 9, \}$ is 5).

Full Text

The Mode

The mode is the value that appears most often in a set of data. For example, the mode of the sample $[1, 3, 6, 6, 6, 6, 7, 7, 12, 12, 17]$ is 6. Like the statistical mean and median, the mode is a way of expressing, in a single number, important information about a random variable or a population.

The mode is not necessarily unique, since the same maximum frequency may be attained at different values. Given the list of data $[1, 1, 2, 4, 4]$ the mode is not unique - the dataset may be said to be bimodal, while a set with more than two modes may be described as multimodal. The most extreme case occurs in uniform distributions, where all values occur equally frequently.

For a sample from a continuous distribution, the concept is unusable in its raw form. No two values will be exactly the same, so each value will occur precisely once. In order to estimate the mode, the usual practice is to discretize the data by assigning frequency values to intervals of equal distance, as with making a histogram, effectively replacing the values with the midpoints of the intervals they are assigned to. The mode is then the value where the histogram reaches its peak.

The Median

The median is the numerical value separating the higher half of a data sample, a population, or a probability distribution, from the lower half. The median of a finite list of numbers can be found by arranging all the observations from lowest value to highest value and picking the middle one (e.g., the median of $\{3,5, 9\}$ is 5). If there is an even number of observations, then there is no single middle value. In this case, the median is usually defined to be the mean of the two middle values.

The median can be used as a measure of location when a distribution is skewed, when end-values are not known, or when one requires reduced importance to be attached to outliers (e.g., because there may be measurement errors).

Which to Use?

In symmetrical, unimodal distributions, such as the normal distribution (the distribution whose density function, when graphed, gives the famous "bell curve"), the mean (if defined), median and mode all coincide. For samples, if it is known that they are drawn from a symmetric distribution, the sample mean can be used as an estimate of the population mode.

If elements in a sample data set increase arithmetically, when placed in some order, then the median and arithmetic mean are equal. For example, consider the data sample $\{1,2,3,4\}$. The mean is 2.5, as is the median. However, when we consider a sample that cannot be arranged so as to increase arithmetically, such as $\{1,2,4,8,16\}$, the median and arithmetic mean can differ significantly. In this case, the arithmetic mean is 6.2 and the median is 4. In general the average value can vary significantly from most values in the sample, and can be larger or smaller than most of them.

While the arithmetic mean is often used to report central tendencies, it is not a robust statistic, meaning that it is greatly influenced by outliers (values that are very much larger or smaller than most of the values). Notably, for skewed distributions, such as the distribution of income for which a few people's incomes are substantially greater than most people's, the arithmetic mean may not be consistent with one's notion of "middle," and robust statistics such as the median may be a better description of central tendency.

The median is of central importance in robust statistics, as it is the most resistant statistic, having a breakdown point of 50%: so long as no more than half the data is contaminated, the median will not give an arbitrarily large result. Robust statistics are statistics with good performance for data drawn from a wide range of probability distributions, especially for distributions that are not normally distributed. One motivation is to produce statistical methods that are not unduly affected by outliers. Another motivation is to provide methods with good performance when there are small departures from parametric distributions.

Unlike median, the concept of mean makes sense for any random variable assuming values from a vector space. For example, a distribution of points in the plane will typically have a mean and a mode, but the concept of median does not apply.

Unlike mean and median, the concept of mode also makes sense for "nominal data" (i.e., not consisting of numerical values in the case of mean, or even of ordered values in the case of median). For example, taking a sample of Korean family names, one might find that "Kim" occurs more often than any other name. Then "Kim" would be the mode of the sample. In any voting system where a plurality determines victory, a single modal value determines the victor, while a multi-modal outcome would require some tie-breaking procedure to take place.
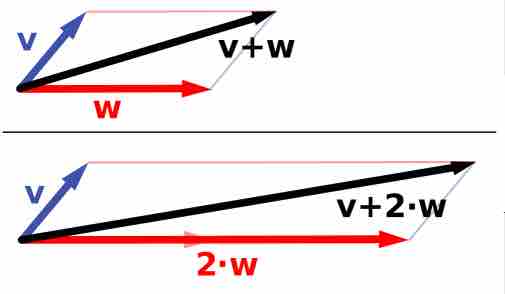
Vector Space

Vector addition and scalar multiplication: a vector $v$ (blue) is added to another vector $w$ (red, upper illustration). Below, $w$ is stretched by a factor of 2, yielding the sum $v+2w$.

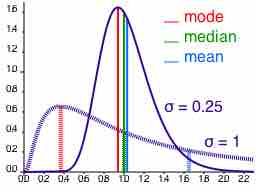
Comparison of the Mean, Mode & Median

Comparison of mean, median and mode of two log-normal distributions with different skewness.

[ edit ]
Edit this content
Prev Concept
The Root-Mean-Square
Averages of Qualitative and Ranked Data
Next Concept
Subjects
  • Accounting
  • Algebra
  • Art History
  • Biology
  • Business
  • Calculus
  • Chemistry
  • Communications
  • Economics
  • Finance
  • Management
  • Marketing
  • Microbiology
  • Physics
  • Physiology
  • Political Science
  • Psychology
  • Sociology
  • Statistics
  • U.S. History
  • World History
  • Writing

Except where noted, content and user contributions on this site are licensed under CC BY-SA 4.0 with attribution required.