Researchers, such as those working in the field of biology, commonly wish to compare regressions and determine causal relationships between two variables. For example, comparing slopes between groups is a method that could be used by a biologist to assess different growth patterns of the development of different genetic factors between groups. Any difference between these factors should result in the presence of differing slopes in the two regression lines.
A method known as analysis of covariance (ANCOVA) can be used to compare two, or more, regression lines by testing the effect of a categorial value on a dependent variable while controlling for the effect of a continuous covariate.
ANCOVA
Covariance is a measure of how much two variables change together and how strong the relationship is between them. Analysis of covariance (ANCOVA) is a general linear model which blends ANOVA and regression. ANCOVA evaluates whether population means of a dependent variable (DV) are equal across levels of a categorical independent variable (IV), while statistically controlling for the effects of other continuous variables that are not of primary interest, known as covariates (CV). Therefore, when performing ANCOVA, we are adjusting the DV means to what they would be if all groups were equal on the CV.
Uses
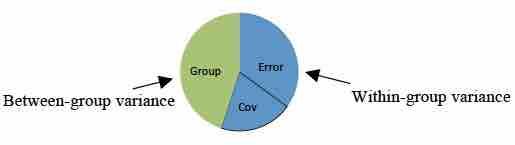
Increase Power. ANCOVA can be used to increase statistical power (the ability to find a significant difference between groups when one exists) by reducing the within-group error variance.
ANCOVA
This pie chart shows the partitioning of variance within ANCOVA analysis.
In order to understand this, it is necessary to understand the test used to evaluate differences between groups, the
If this value is larger than a critical value, we conclude that there is a significant difference between groups. When we control for the effect of CVs on the DV, we remove it from the denominator making
Adjusting Preexisting Differences. Another use of ANCOVA is to adjust for preexisting differences in nonequivalent (intact) groups. This controversial application aims at correcting for initial group differences (prior to group assignment) that exists on DV among several intact groups. In this situation, participants cannot be made equal through random assignment, so CVs are used to adjust scores and make participants more similar than without the CV.
Assumptions
There are five assumptions that underlie the use of ANCOVA and affect interpretation of the results:
- Normality of Residuals. The residuals (error terms) should be normally distributed.
- Homogeneity of Variances. The error variances should be equal for different treatment classes.
- Homogeneity of Regression Slopes. The slopes of the different regression lines should be equal (in our current context, this assumption is what will be tested).
- Linearity of Regression. The regression relationship between the dependent variable and concomitant variables must be linear.
- Independence of Error terms. The error terms should be uncorrelated.
The Test
In the context of ANCOVA, regression lines are compared by studying the interaction between the treatment effect and the independent variable. If the interaction (i.e., the
It is also possible to see similar slopes between lines but a different intercept. Differing intercepts can be interpreted as a difference in magnitudes but not in the rate of change. Differing slopes would imply differing rates of change and possibly differing magnitudes, as well.