Least Squares Regression
The process of fitting the best- fit line is called linear regression. Finding the best fit line is based on the assumption that the data are scattered about a straight line. The criteria for the best fit line is that the sum of squared errors (SSE) is made as small as possible. Any other potential line would have a higher SSE than the best fit line. Therefore, this best fit line is called the least squares regression line.
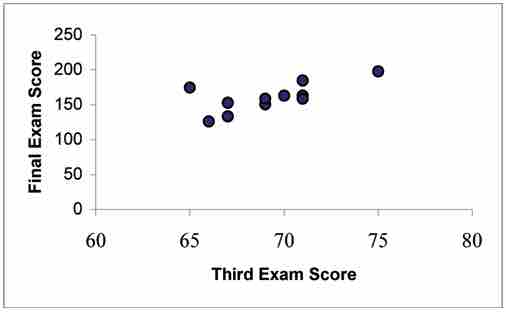
Here is a scatter plot that shows a correlation between ordinary test scores and final exam test scores for a statistics class:
Test Score Scatter Plot
This graph shows the various scattered data points of test scores.
The following figure shows how a best fit line can be drawn through the scatter plot graph: .
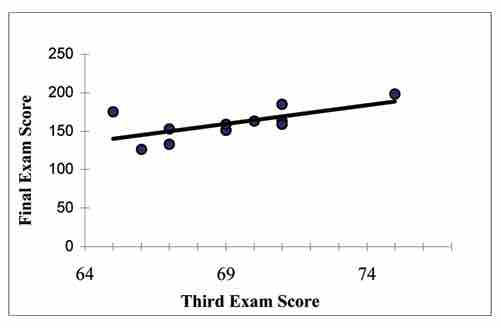
Best Fit Line
This shows how the scatter plots form a best fit line, implying there may be correlation.
Ordinary Least Squares Regression
Ordinary Least Squares (OLS) regression (or simply "regression") is a useful tool for examining the relationship between two or more interval/ratio variables assuming there is a linear relationship between said variables. If the relationship is not linear, OLS regression may not be the ideal tool for the analysis, or modifications to the variables/analysis may be required. If there is a linear relationship between two variables, you can use one variable to predict values of the other variable. For example, because there is a linear relationship between height and weight, if you know someone's height, you can better estimate their weight. Using a basic line formula, you can calculate predicted values of your dependent variable using your independent variable, allowing you to make better predictions.
This method minimizes the sum of squared vertical distances between the observed responses in the dataset and the responses predicted by the linear approximation. The resulting estimator can be expressed by a simple formula, especially in the case of a single regressor on the right-hand side. The OLS estimator is consistent when the regressors are exogenous and there is no perfect multicollinearity. It is considered optimal in the class of linear unbiased estimators when the errors are homoscedastic and serially uncorrelated. Under these conditions, the method of OLS provides minimum-variance, mean-unbiased estimation when the errors have finite variances. Under the additional assumption that the errors are normally distributed, OLS is the maximum likelihood estimator. OLS is used in fields such as economics (econometrics), political science, and electrical engineering (control theory and signal processing), among others