When working with multiple regression models, a number of assumptions must be made. These assumptions are similar to those of standard linear regression models. The following are the major assumptions with regard to multiple regression models:
- Linearity. When looking at a scatterplot of data, it is important to check for linearity between the dependent and independent variables. If the data does not appear as linear, but rather in a curve, it may be necessary to transform the data or use a different method of analysis. Fortunately, slight deviations from linearity will not greatly affect a multiple regression model.
- Constant variance (aka homoscedasticity). Different response variables have the same variance in their errors, regardless of the values of the predictor variables. In practice, this assumption is invalid (i.e., the errors are heteroscedastic) if the response variables can vary over a wide scale. In order to determine for heterogeneous error variance, or when a pattern of residuals violates model assumptions of homoscedasticity (error is equally variable around the 'best-fitting line' for all points of x), it is prudent to look for a "fanning effect" between residual error and predicted values. That is, there will be a systematic change in the absolute or squared residuals when plotted against the predicting outcome. Error will not be evenly distributed across the regression line. Heteroscedasticity will result in the averaging over of distinguishable variances around the points to yield a single variance (inaccurately representing all the variances of the line). In effect, residuals appear clustered and spread apart on their predicted plots for larger and smaller values for points along the linear regression line; the mean squared error for the model will be incorrect.
- Normality. The residuals (predicted value minus the actual value) should follow a normal curve. Once again, this need not be exact, but it is a good idea to check for this using either a histogram or a normal probability plot.
- Multicollinearity. Independent variables should not be overly correlated with one another (they should have a regression coefficient less than 0.7).
- Sample size. Most experts recommend that there should be at least 10 to 20 times as many observations (cases, respondents) as there are independent variables, otherwise the estimates of the regression line are probably unstable and unlikely to replicate if the study is repeated.
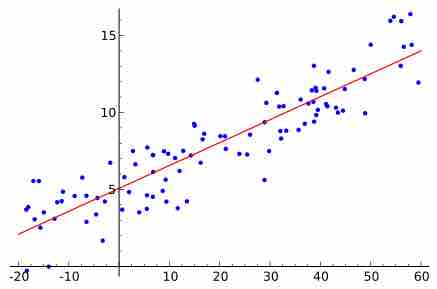
Linear Regression
Random data points and their linear regression.