Statistics
Textbooks
Boundless Statistics
Continuous Random Variables
Normal Approximation
Statistics Textbooks Boundless Statistics Continuous Random Variables Normal Approximation
Statistics Textbooks Boundless Statistics Continuous Random Variables
Statistics Textbooks Boundless Statistics
Statistics Textbooks
Statistics
Concept Version 10
Created by Boundless

Change of Scale

In order to consider a normal distribution or normal approximation, a standard scale or standard units is necessary.

Learning Objective

  • Explain the significance of normalization of ratings and calculate this normalization


Key Points

    • In the simplest cases, normalization of ratings means adjusting values measured on different scales to a notionally common scale, often prior to averaging.
    • In more complicated cases, normalization may refer to more sophisticated adjustments where the intention is to bring the entire probability distributions of adjusted values into alignment.
    • The standard score is a dimensionless quantity obtained by subtracting the population mean from an individual raw score and then dividing the difference by the population standard deviation.
    • A key point is that calculating $z$ requires the population mean and the population standard deviation, not the sample mean or sample deviation.

Terms

  • datum

    A measurement of something on a scale understood by both the recorder (a person or device) and the reader (another person or device).

  • standard score

    The number of standard deviations an observation or datum is above the mean.

  • normalization

    The process of removing statistical error in repeated measured data.


Full Text

In order to consider a normal distribution or normal approximation, a standard scale or standard units is necessary.

Normalization

In the simplest cases, normalization of ratings means adjusting values measured on different scales to a notionally common scale, often prior to averaging. In more complicated cases, normalization may refer to more sophisticated adjustments where the intention is to bring the entire probability distributions of adjusted values into alignment. In the case of normalization of scores in educational assessment, there may be an intention to align distributions to a normal distribution. A different approach to normalization of probability distributions is quantile normalization, where the quantiles of the different measures are brought into alignment.

Normalization can also refer to the creation of shifted and scaled versions of statistics, where the intention is that these normalized values allow the comparison of corresponding normalized values for different datasets. Some types of normalization involve only a rescaling, to arrive at values relative to some size variable.

The Standard Score

The standard score is the number of standard deviations an observation or datum is above the mean. Thus, a positive standard score represents a datum above the mean, while a negative standard score represents a datum below the mean. It is a dimensionless quantity obtained by subtracting the population mean from an individual raw score and then dividing the difference by the population standard deviation. This conversion process is called standardizing or normalizing.

Standard scores are also called $z$-values, $z$-scores, normal scores, and standardized variables. The use of "$Z$" is because the normal distribution is also known as the "$Z$ distribution". They are most frequently used to compare a sample to a standard normal deviate (standard normal distribution, with $\mu = 0$ and $\sigma = 1$).

The $z$-score is only defined if one knows the population parameters. If one only has a sample set, then the analogous computation with sample mean and sample standard deviation yields the Student's $t$-statistic.

The standard score of a raw score $x$ is:

$\displaystyle z=\frac { x-\mu }{ \sigma }$

Where $\mu$ is the mean of the population, and is the standard deviation of the population. The absolute value of $z$ represents the distance between the raw score and the population mean in units of the standard deviation. $z$ is negative when the raw score is below the mean, positive when above.

A key point is that calculating $z$ requires the population mean and the population standard deviation, not the sample mean or sample deviation. It requires knowing the population parameters, not the statistics of a sample drawn from the population of interest. However, knowing the true standard deviation of a population is often unrealistic except in cases such as standardized testing, where the entire population is measured. In cases where it is impossible to measure every member of a population, a random sample may be used.

The $Z$ value measures the sigma distance of actual data from the average and provides an assessment of how off-target a process is operating.

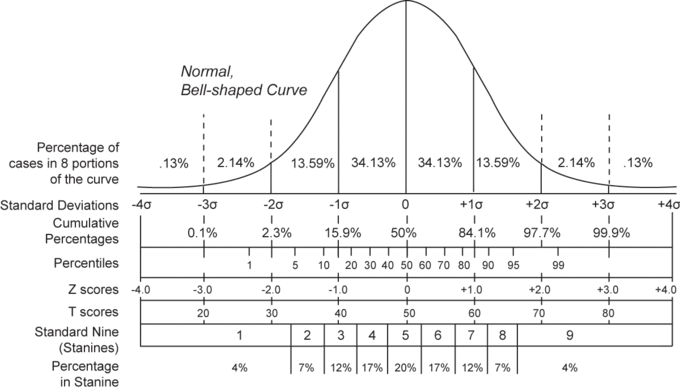
Normal Distribution and Scales

Compares the various grading methods in a normal distribution. Includes: standard deviations, cumulative percentages, percentile equivalents, $Z$-scores, $T$-scores, and standard nine.

[ edit ]
Edit this content
Prev Concept
Calculating a Normal Approximation
Bias
Next Concept
Subjects
  • Accounting
  • Algebra
  • Art History
  • Biology
  • Business
  • Calculus
  • Chemistry
  • Communications
  • Economics
  • Finance
  • Management
  • Marketing
  • Microbiology
  • Physics
  • Physiology
  • Political Science
  • Psychology
  • Sociology
  • Statistics
  • U.S. History
  • World History
  • Writing

Except where noted, content and user contributions on this site are licensed under CC BY-SA 4.0 with attribution required.