The oxyhaemoglobin dissociation curve
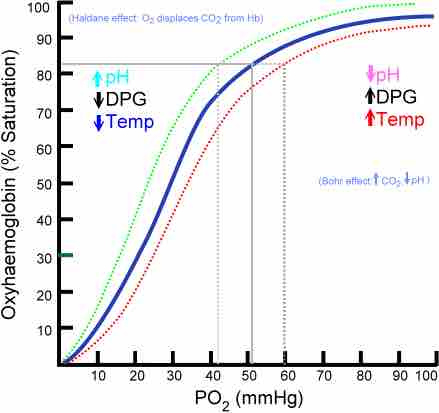
The oxygen–hemoglobin dissociation curve plots the percent hemoglobin saturation (y-axis) against the partial pressure of oxygen in the blood (PO2). The blue curve is standard curve, while the red and green curves are right and leftward shifts respectively.
This is a graph of the oxyhaemoglobin dissociation curve. The oxygen–hemoglobin dissociation curve plots the percent hemoglobin saturation (y-axis) against the partial pressure of oxygen in the blood (x-axis). The graph shows three colored curves: the blue curve is the standard curve, while the red and green curves are right and leftward shifts respectively.
Source
Boundless vets and curates high-quality, openly licensed content from around the Internet. This particular resource used the following sources:
"Oxyhaemoglobin dissociation curve."
http://en.wikipedia.org/wiki/File:Oxyhaemoglobin_dissociation_curve.png
Wikimedia Commons
Public domain.