Perceptual Mapping
Perceptual mapping is a diagrammatic technique used by marketers in an attempt to visually display the perceptions of customers or potential customers. Typically the position of a product, product line, brand, or company is displayed relative to their competition. Some perceptual maps use different size circles to indicate the sales volume or market share of the various competing products.
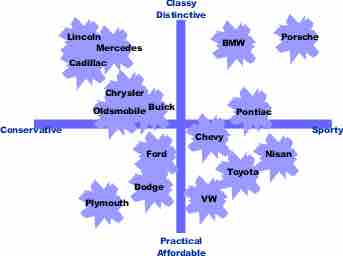
Perceptual Map Of Competing Products
Perceptual maps commonly have two dimensions even though they are capable of having several. For example, in this perceptual map you can see consumer perceptions of various automobiles on the two dimensions of sportiness/conservative and classy/affordable. This sample of consumers felt that Porsche cars were the sportiest and classiest of the ones in the study. They felt that Plymouth cars were the most practical and conservative. Cars that are positioned close to each other were seen as similar on the relevant dimensions by the consumer. For example, consumers saw Buick, Chrysler, and Oldsmobile as similar. They are close competitors and form a competitive grouping. A company considering the introduction of a new model will look for an area on the map free from competitors.
Perceptual mapping
This is an example of a perceptual map.
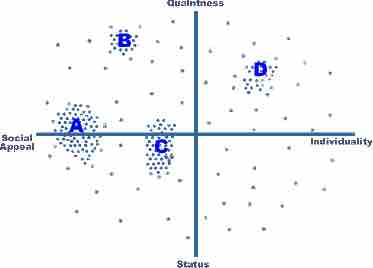
Perceptual Map Of a Consumer's Ideal
Many perceptual maps also display consumers' ideal points. These points reflect ideal combinations of the two product characteristics as seen by a consumer. This diagram shows a study of consumers' ideal points in the alcohol product space. Each dot represents one respondent's ideal combination of the two dimensions. Areas where there is a cluster of ideal points (such as A) indicates a market segment. Areas without ideal points are sometimes referred to as demand voids.
Perceptual Map of Ideal Points in the Alcohol Product Space
Ideal points maps reflect ideal combinations of two product characteristics as seen by a consumer. This helps marketers accurately target their message to consumers based on consumer desires.
Combining the Competing Products and Ideal Points Maps
A company considering introducing a new product will look for areas with a high density of ideal points. They will also look for areas without competitive rivals. This is best done by placing both the ideal points and the competing products on the same map. This map displays various aspirin products as seen on the dimensions of effectiveness and gentleness. It also shows two ideal vectors. This study indicates that there is one segment that is more concerned with effectiveness than harshness, and another segment that is more interested in gentleness than strength.
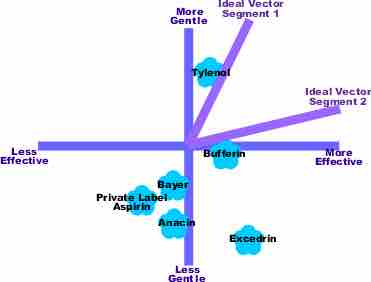
Combination Map of Competing Products and Ideal Points
A combination map allows companies to find a space that has unmet consumer desires.
Intuitive Maps
Perceptual maps need not come from a detailed study. There are also intuitive maps (also called judgmental maps or consensus maps) that are created by marketers based on their understanding of their industry. The value of this type of map is questionable, as they often just give the appearance of credibility to management's preconceptions. When detailed marketing research studies are done, methodological problems can arise, but at least the information is coming directly from the consumer. There is an assortment of statistical procedures (preference regression, multi-dimensional scaling) that can be used to convert the raw data collected in a survey into a perceptual map.
Some techniques are constructed from perceived differences between products, others are constructed from perceived similarities. Still others are constructed from cross price elasticity of demand data from electronic scanners.