Break-Even Point
In economics and business, the break-even point (BEP) is when costs (or expenses) and revenues are equal: there is no net loss or gain and the business has "broken even" by earning back its costs.
Identifying BEP
Break-even analysis determines the minimum quantity a company needs to sell in order to cover its minimum costs, including rent, building expenses, utilities, and the operational costs of running day-to-day operations. As long as a business can cover its minimum costs, it is "breaking even" and can remain in business even if it is not turning a profit.
For example: a business selling tables has a BEP of 200 tables per month. If the company sells fewer than 200 tables each month, it loses money; if it sells more, it makes a profit. Business leaders use this information to determine whether or not they will produce and sell 200 tables per month and proceed based on that analysis. If they estimate they cannot sell that many, they can reduce their fixed costs (renegotiating rent, keeping phone bills or other expenses down), reduce variable costs (paying less for materials per item produced, usually by finding a new supplier), or raise the price of their tables. Any of these approaches would lower the break-even point; the company might only need to sell 150 tables per month and pay its fixed costs if it can cover or alter them through other means.
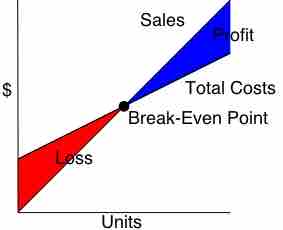
A break-even analysis is typically depicted by a graph showing the midpoint between profit and loss with the axes as units sold and price of goods sold. The graph shows when sales can cover fixed costs so the company will be able to stay in business in the short-term. Over a longer period of time, other factors can come into play, like changes in rent or quantity sold, or other competitors entering the market.
Break-even analysis
Break-even points can be determined based on sales and total costs. The point is found at the number of units where loss and sales are equal.
Project Managers and Break-Even Analysis
Break-even analysis lets companies compare their production or sales with the minimum point (the break-even point) they need to achieve in order to stay in business. Typically, companies want to produce above BEP in order to make a profit and will adjust their output level to surpass the break-even point.
Because they are in charge of specific process flows, understanding BEP and how to lower it through operational efficiency is central to the responsibilities of a project manager (PM). When making financial projections or pitching a new line of goods, the PM must estimate BEP and how they can exceed it in a given market. BEP, in this sense, is a feasibility model for either continuing an existing operation or opening a new one.