Why Leverage Matters
Before learning each calculation, it's useful to frame the issue of leverage first. Operating leverage is largely predicated on fixed costs. When fixed costs are high (and variable costs are low), there is quite a bit of risk if the volume of production is low. However, strong increases in revenues will eventually result in substantially higher increase in profitability (as the relative impact of variable costs is lower, and the fixed cost is being divided by higher quantity). The equations below will demonstrate this concept in practice and clarify the concept. What's important to keep in mind is the importance of fixed costs compared to variable costs, and the impact this can have on financial leverage.
Leverage Models
Most of the calculations and models for leverage are relatively intuitive when looking at examples.
Let's say you own a business selling coffee. Each cup of coffee you sell costs you about $0.10. You're want to beat out the competition on price, so you sell your coffees pretty low at $1.00/coffee. As you can see, your variable cost is only 10% of the overall revenue. The rest of those costs (plus the profit left over) fall into the fixed costs category. After being in business for one year, you have spent a total of $100,000 acquiring the fixed assets you need (a small location, coffee machines, grinders, chairs, tables, and other random necessities).
If you sell one cup of coffee, you've spent $100,000.10 and made $1.00. Not so profitable at this point, as you can see. Your fixed costs compared to your total costs is pretty much 100%. To find our where you'll break even, simply subtract the variable cost from the sale price and divide that by the fixed costs (i.e. how many $0.90 profits are required to cover the full $100,000 you owe in fixed costs). Around your 111,111 cup of coffee, you'll find yourself just about even. After this point, pretty much every cup of coffee you sell if 90% profit and 10% cost. Not bad, right? But it'll take a lot of leverage to get there, and therefore there is always the risk you'll go out of business before you make it to your 111,111th cup of coffee.
So, the model for leverage in this case is fixed costs/total costs (or fixed costs/fixed costs + variable costs):
The Degree of Operating Leverage
Calculating the overall degree of operating leverage is an important strategic consideration to make as often as possible. The cleanest way to few this is as the overall change in operating income compared to the overall change in sales:
It is also useful to frame this as the operating margin, which compares the overall revenue to the overall operating income. This is more of a snapshot of the current situation, while the DOL above is more in tune with relative changes over time.
At the core of degree of operating leverage is the same concept discussed in the example above. The overall amount gained per new unit sold changes based on the ratio between fixed and variable costs, and this change is what is being modeled what talking about leverage.
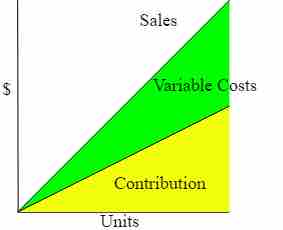
Variable Costs and Contribution
After filtering out the fixed costs, increases in volume will increase both the overall variable expense and the overall contribution.