The Phillips curve relates the rate of inflation with the rate of unemployment. The Phillips curve argues that unemployment and inflation are inversely related: as levels of unemployment decrease, inflation increases. The relationship, however, is not linear. Graphically, the short-run Phillips curve traces an L-shape when the unemployment rate is on the x-axis and the inflation rate is on the y-axis .
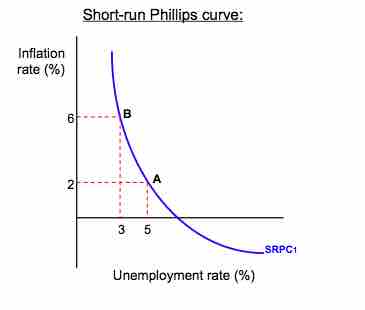
Theoretical Phillips Curve
The Phillips curve shows the inverse trade-off between inflation and unemployment. As one increases, the other must decrease. In this image, an economy can either experience 3% unemployment at the cost of 6% of inflation, or increase unemployment to 5% to bring down the inflation levels to 2%.
History
The early idea for the Phillips curve was proposed in 1958 by economist A.W. Phillips. In his original paper, Phillips tracked wage changes and unemployment changes in Great Britain from 1861 to 1957, and found that there was a stable, inverse relationship between wages and unemployment. This correlation between wage changes and unemployment seemed to hold for Great Britain and for other industrial countries. In 1960, economists Paul Samuelson and Robert Solow expanded this work to reflect the relationship between inflation and unemployment. Because wages are the largest components of prices, inflation (rather than wage changes) could be inversely linked to unemployment.
The theory of the Phillips curve seemed stable and predictable. Data from the 1960's modeled the trade-off between unemployment and inflation fairly well. The Phillips curve offered potential economic policy outcomes: fiscal and monetary policy could be used to achieve full employment at the cost of higher price levels, or to lower inflation at the cost of lowered employment. However, when governments attempted to use the Phillips curve to control unemployment and inflation, the relationship fell apart. Data from the 1970's and onward did not follow the trend of the classic Phillips curve. For many years, both the rate of inflation and the rate of unemployment were higher than the Phillips curve would have predicted, a phenomenon known as "stagflation. " Ultimately, the Phillips curve was proved to be unstable, and therefore, not usable for policy purposes .
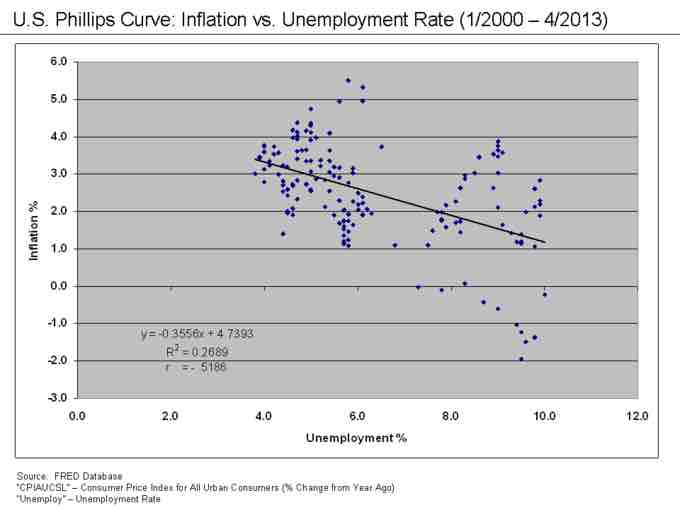
US Phillips Curve (2000 - 2013)
The data points in this graph span every month from January 2000 until April 2013. They do not form the classic L-shape the short-run Phillips curve would predict. Although it was shown to be stable from the 1860's until the 1960's, the Phillips curve relationship became unstable - and unusable for policy-making - in the 1970's.