Economics
Textbooks
Boundless Economics
Inflation and Unemployment
The Relationship Between Inflation and Unemployment
Economics Textbooks Boundless Economics Inflation and Unemployment The Relationship Between Inflation and Unemployment
Economics Textbooks Boundless Economics Inflation and Unemployment
Economics Textbooks Boundless Economics
Economics Textbooks
Economics
Concept Version 7
Created by Boundless

The Phillips Curve

US Phillips Curve (2000 - 2013)

US Phillips Curve (2000 - 2013)

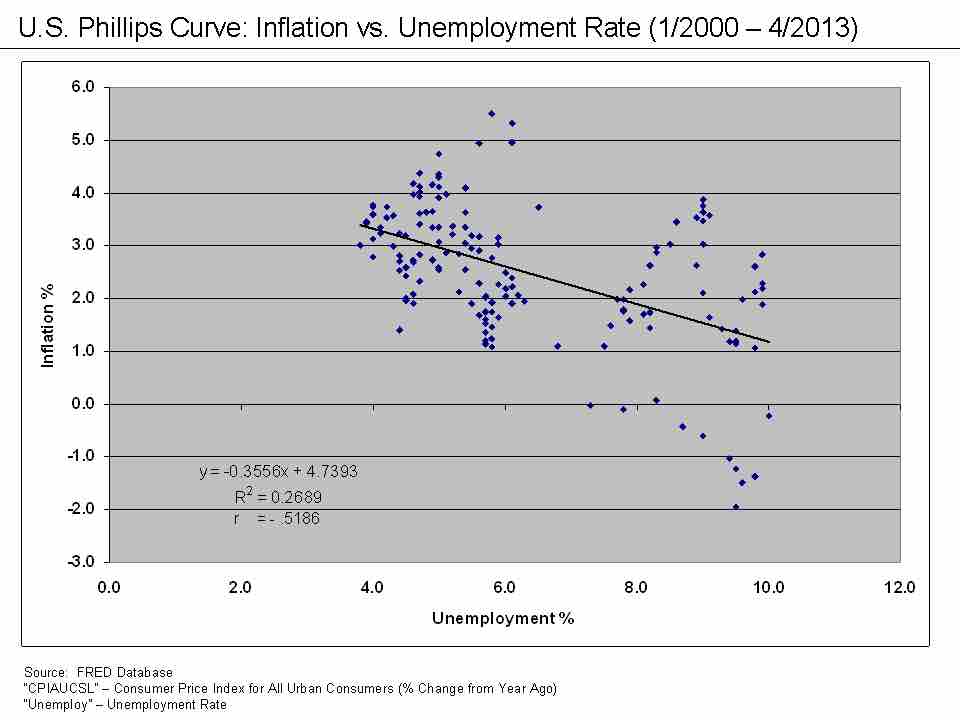
The data points in this graph span every month from January 2000 until April 2013. They do not form the classic L-shape the short-run Phillips curve would predict. Although it was shown to be stable from the 1860's until the 1960's, the Phillips curve relationship became unstable - and unusable for policy-making - in the 1970's.

Source

    Boundless vets and curates high-quality, openly licensed content from around the Internet. This particular resource used the following sources:

    "U.S. Phillips Curve 2000 to 2013."
    http://en.wikipedia.org/wiki/File:U.S._Phillips_Curve_2000_to_2013.png Wikipedia CC BY-SA.

Related Terms

  • stagflation
  • Phillips curve
  • Subjects
    • Accounting
    • Algebra
    • Art History
    • Biology
    • Business
    • Calculus
    • Chemistry
    • Communications
    • Economics
    • Finance
    • Management
    • Marketing
    • Microbiology
    • Physics
    • Physiology
    • Political Science
    • Psychology
    • Sociology
    • Statistics
    • U.S. History
    • World History
    • Writing

    Except where noted, content and user contributions on this site are licensed under CC BY-SA 4.0 with attribution required.