Economics
Textbooks
Boundless Economics
Economic Surplus
Producer Surplus
Economics Textbooks Boundless Economics Economic Surplus Producer Surplus
Economics Textbooks Boundless Economics Economic Surplus
Economics Textbooks Boundless Economics
Economics Textbooks
Economics
Concept Version 8
Created by Boundless

Defining Producer Surplus

Producer surplus is the difference between the amount producers get for selling a good and the amount they want to accept for that good.

Learning Objective

  • Define producer surplus


Key Points

    • Producer surplus can be thought of as the extra money, utility, or benefits the producer receives by selling a product at a price that is higher than its minimum acceptable price.
    • The minimum acceptable price for producers is represented by the supply curve.
    • Graphically, producer surplus is the shaded region just above the supply curve, but below the equilibrium price level.

Term

  • producer surplus

    The amount that producers benefit by selling at a market price that is higher than the lowest price at which they would be willing to sell.


Full Text

Producer surplus is the difference between what price producers are willing and able to supply a good for and what price they actually receive from consumers. It is the extra money, benefit, and/or utility producers get from selling a product at a price that is higher than their minimum accepted price, as shown by the supply curve.
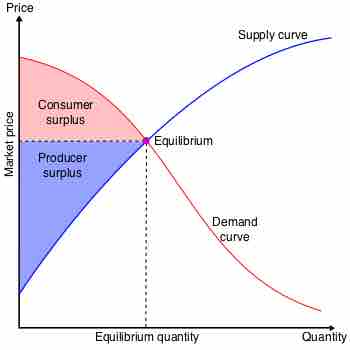
Economic Surplus

Producer surplus is the shaded area directly above the supply curve, up to the equilibrium point. Consumer surplus is the shaded area directly under the demand curve, up to the equilibrium point.

For example, above, the equilibrium price is $P'$. However, at $P_1$, the producers are willing to sell one unit of a commodity for a price that is lower than $P'$. The resulting rectangle from $P_1$ on the $y$-axis, to its intersection with the supply curve, up to the level of $P'$ is the producer surplus at price level $P_1$.

Similarly, at $P_2$, the producers are willing to sell two units of a commodity at a price that is still lower than $P'$. The rectangle from $P_2$ on the $y$-axis, to its intersection with the supply curve, up to the level of $P'$ is the new producer surplus at price $P_2$. The total producer surplus at $P_2$ is the first rectangle at the $P_1$ price, plus the new rectangle from the $P_2$ price.

This process is repeated for every price level up to the equilibrium price. To find the resulting total producer surplus, all of the rectangles for the individual price levels are added together, and the total area is the total producer surplus. Below, the total producer surplus is made of all three pink rectangles - the surpluses at price levels of
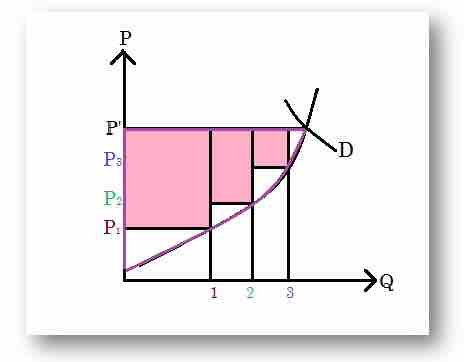
 $P_1$, $P_2$, and $P_3$ - added together.

Producer surplus

In the figure, producer surplus at different prices is represented by the pink rectangles.

[ edit ]
Edit this content
Prev Concept
Market Power
Impact of Changing Price on Producer Surplus
Next Concept
Subjects
  • Accounting
  • Algebra
  • Art History
  • Biology
  • Business
  • Calculus
  • Chemistry
  • Communications
  • Economics
  • Finance
  • Management
  • Marketing
  • Microbiology
  • Physics
  • Physiology
  • Political Science
  • Psychology
  • Sociology
  • Statistics
  • U.S. History
  • World History
  • Writing

Except where noted, content and user contributions on this site are licensed under CC BY-SA 4.0 with attribution required.