A phase diagram is a graph which shows under what conditions of temperature and pressure distinct phases of matter occur. The simplest phase diagrams are of pure substances. These diagrams plot pressure on the y-axis and temperature on the x-axis.
Although phases are conceptually simple, they are difficult to define precisely. The phase of a system is generally defined as the region in the parameter space of the system's thermodynamic variables (for immediate purposes, in the pressure-temperature parameter space) in which the system's free energy is analytic (meaning it can be calculated exactly from known parameters of the system).
The major features of a phase diagram are phase boundaries and the triple point.
- Phase boundaries, or lines of equilibrium, are boundaries that indicate the conditions under which two phases of matter can coexist at equilibrium.
- The triple point is the point on the phase diagram where the lines of equilibrium intersect -- the point at which all three distinct phases of matter (solid, liquid, gas) coexist.
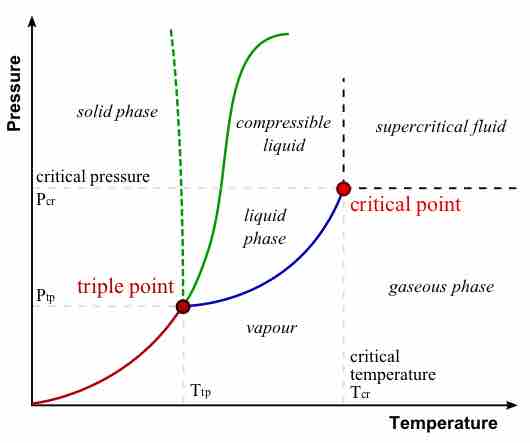
Phase Diagram
In this phase diagram, which is typical of most substances, the solid lines represent the phase boundaries. The green line marks the freezing point (or transition from liquid to solid), the blue line marks the boiling point (or transition from liquid to gas), and the red line shows the conditions under which a solid can be converted directly to a gas (and vice-versa). The dotted green line is meant to replace the solid green line in the corresponding phase diagram of water. It illustrates water's anomalous behavior.
The phase diagram for water is useful for learning how to analyze these diagrams. Along the blue phase boundary, water exists as both a vapor and a liquid. Along the dotted green phase boundary, we see the anomalous behavior of water: it exists as a solid at low-enough temperatures and high-enough pressures. At the triple point, water in the solid, liquid, and gaseous states coexist.