Chemistry
Textbooks
Boundless Chemistry
Liquids and Solids
Phase Diagrams
Chemistry Textbooks Boundless Chemistry Liquids and Solids Phase Diagrams
Chemistry Textbooks Boundless Chemistry Liquids and Solids
Chemistry Textbooks Boundless Chemistry
Chemistry Textbooks
Chemistry
Concept Version 8
Created by Boundless

Major Features of a Phase Diagram

Phase Diagram

Phase Diagram

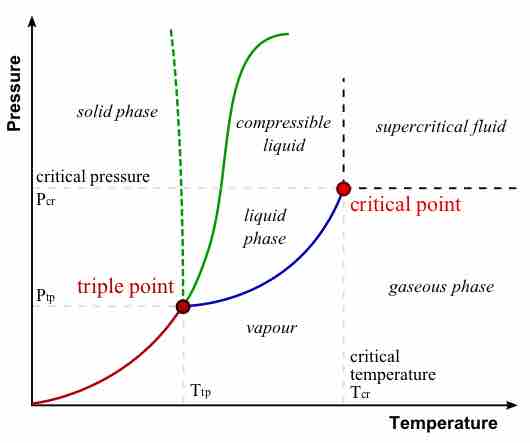
In this phase diagram, which is typical of most substances, the solid lines represent the phase boundaries. The green line marks the freezing point (or transition from liquid to solid), the blue line marks the boiling point (or transition from liquid to gas), and the red line shows the conditions under which a solid can be converted directly to a gas (and vice-versa). The dotted green line is meant to replace the solid green line in the corresponding phase diagram of water. It illustrates water's anomalous behavior.

Source

    Boundless vets and curates high-quality, openly licensed content from around the Internet. This particular resource used the following sources:

    "Phase diagram."
    http://en.wikipedia.org/wiki/Phase_diagram Wikipedia GNU FDL.

Related Terms

  • Triple point
  • phase boundary
  • Subjects
    • Accounting
    • Algebra
    • Art History
    • Biology
    • Business
    • Calculus
    • Chemistry
    • Communications
    • Economics
    • Finance
    • Management
    • Marketing
    • Microbiology
    • Physics
    • Physiology
    • Political Science
    • Psychology
    • Sociology
    • Statistics
    • U.S. History
    • World History
    • Writing

    Except where noted, content and user contributions on this site are licensed under CC BY-SA 4.0 with attribution required.