Chemistry
Textbooks
Boundless Chemistry
Introduction to Quantum Theory
Bohr's Theory
Chemistry Textbooks Boundless Chemistry Introduction to Quantum Theory Bohr's Theory
Chemistry Textbooks Boundless Chemistry Introduction to Quantum Theory
Chemistry Textbooks Boundless Chemistry
Chemistry Textbooks
Chemistry
Concept Version 10
Created by Boundless

Emission Spectrum of the Hydrogen Atom

The emission spectrum of atomic hydrogen is divided into a number of spectral series.

Learning Objective

  • Calculate emission spectra for Hydrogen using the Rydberg formula


Key Points

    • The wavelengths in a spectral series are given by the Rydberg formula.
    • The observed spectral lines are due to electrons moving between energy levels in an atom.
    • Further series are unnamed but follow exactly the same pattern as dictated by the Rydberg equation.

Terms

  • spectrum

    A range of colors representing light (electromagnetic radiation) of contiguous frequencies; hence electromagnetic spectrum, visible spectrum, ultraviolet spectrum, etc.

  • emission

    In a spectral sense, what occurs when an electron transitions between a higher energy level and a lower one, resulting in the release of a photon of predictable energy.


Full Text

The emission spectrum of a chemical element or chemical compound is the spectrum of frequencies of electromagnetic radiation emitted by an atom's electrons when they are returned to a lower energy state. Each element's emission spectrum is unique, and therefore spectroscopy can be used to identify elements present in matter of unknown composition. Similarly, the emission spectra of molecules can be used in chemical analysis of substances.

Emission spectrum of atomic hydrogen

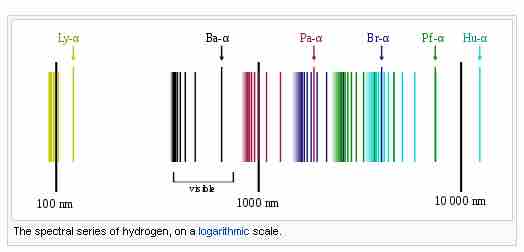
Spectral series of hydrogen.

The emission spectrum of atomic hydrogen is divided into a number of spectral series, with wavelengths given by the Rydberg formula: $\frac { 1 }{ \lambda_{vac} } =RZ^2( \frac { 1 }{ {n_1 }^{ 2 } } -\frac { 1 }{ { n_2 }^{ 2 } })$,

where R is the Rydberg constant (approximately 1.09737 x 10⁷ m-1), $\lambda_{vac}$ is the wavelength of the light emitted in vacuum, Z is the atomic number, and n1 and n2 are integers representing the energy levels involved such that n1 < n2. All observed spectral lines are due to electrons moving between energy levels in the atom. The spectral series are important in astronomy for detecting the presence of hydrogen and calculating red shifts. Further series for hydrogen as well as other elements were discovered as spectroscopy techniques developed.

The line spectrum of hydrogen

Explain how the lines in the emission spectrum of hydrogen are related to electron energy levels. You need to understand convergence, production of UV, vis, IR, excitation, concentric energy levels and be able to draw the line spectra.

The spectral lines are grouped into series according to n′. Lines are named sequentially starting from the longest wavelength/lowest frequency of the series using Greek letters within each series. For example, the 2 → 1 line is called Lyman-alpha (Ly-α), while the 7 → 3 line is called Paschen-delta (Pa-δ). Some hydrogen spectral lines fall outside these series, such as the 21 cm line (these correspond to much rarer atomic events such as hyperfine transitions). The fine structure also results in single spectral lines appearing as two or more closely grouped thinner lines due to relativistic corrections. Typically, one can only observe these series from pure hydrogen samples in a lab. Many of the lines are very faint and additional lines can be caused by other elements (such as helium if using sunlight or nitrogen in the air). Lines outside of the visible spectrum typically cannot be seen in observations of sunlight, as the atmosphere absorbs most infrared and ultraviolet wavelengths through the action of water vapor and ozone molecules respectively.

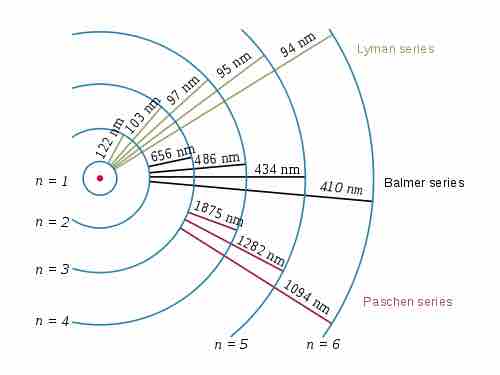
Electron transitions and their resulting wavelengths for hydrogen

Three of the transition series in hydrogen (not to scale).

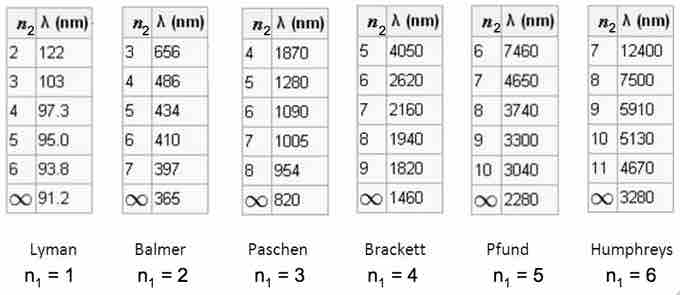
The emission spectrum of hydrogen

Some of the most common and readily observable series have been named as shown in this image, where n1 is the ground state and n2 are excited states. The various series are named for the atomic energy level they end on (n1). The series limit where n2 is infinite and n1=1 corresponds to the ionization energy of hydrogen.

[ edit ]
Edit this content
Prev Concept
The Photoelectric Effect
The Bohr Model
Next Concept
Subjects
  • Accounting
  • Algebra
  • Art History
  • Biology
  • Business
  • Calculus
  • Chemistry
  • Communications
  • Economics
  • Finance
  • Management
  • Marketing
  • Microbiology
  • Physics
  • Physiology
  • Political Science
  • Psychology
  • Sociology
  • Statistics
  • U.S. History
  • World History
  • Writing

Except where noted, content and user contributions on this site are licensed under CC BY-SA 4.0 with attribution required.