Consider the company Bounded Inc., a magazine publisher, to illustrate the financials of a company. The following information is based on the company's FY (financial year) 2011 performance:
- Cash: $3,230
- Cost of Goods Sold: $2,390
- Current Assets: $1,000
- Current Liabilities: $3,500
- Depreciation: $800
- Fixed Assets: $8,600
- Interest Payments: $300
- Inventory: $2,010
- Long-term Debt: $3,000
- Sales: $5,000
Using the information above, we can compile the balance sheet and the income statement. We can also calculate some financial ratios to determine the company's financial situation. Keep in mind that for most ratios, the number must be compared against competitors and industry standards for it to be meaningful:
ROA (Return on Assets) = Net Income / Total Assets = 1,057 / 13,840 = 7.6%
This means that for every dollar of assets the company controls, it derives $0.076 of profit. This would need to be compared to others in the same industry to determine whether this is a high or low figure.
Profit Margin = Net Income / Net Sales = 1,057/5,000 = 21.1 percent
This figure would need to be compared to competitors. A lower profit margin indicates a low margin of safety.
ROE (Return on Equity) = Net Income / Shareholder Equity = 1,057/7,340 = 14.4 percent
The ROE measures the firm's ability to generate profits from every unit of shareholder equity. 0.144 (or 14 percent) is not a bad figure, but by no means a very good once, since ROE's between 15 to 20 percent are generally considered good.
BEP Ratio = EBIT / Total Assets = 1,810/13,840 = 0.311
Current Ratio = Current Assets / Current Liabilities = 5,240/3,500 = 1.497
This demonstrates that the company does not seem to be in a tight position in terms of liquidity.
Quick Ratio = (Current Assets-Inventories) / Current Liabilities = (5,240 - 2,010) / 3,500 = 0.923
Despite having a current ratio of about 1.0, the quick ratio is slightly below 1.0. This means that the company may face liquidity problems should payment of current liabilities be demanded immediately. But it does not seem to be a huge cause for concern.
Debt Ratio = Total Debt / Total Assets = 6,500/13,840 = 47 percent
This indicates the percentage of a company's assets that are provided via debt. The higher the ratio, the greater risk will be associated with the firm's operation.
D/E Ratio = Long-term Debt/Equity = 3,000/7,340 = 40.9 percent
This shows the relative proportion of shareholders' equity and debt used to finance a company's assets. Once again, comparisons should be made between companies in the same industry in order to determine whether this is a low or high figure.
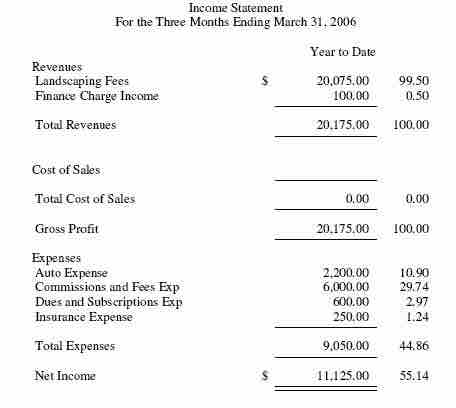
Financial Statement
One form of financial statement is the income statement.