Algebra
Textbooks
Boundless Algebra
Quadratic Functions and Factoring
Applications of Quadratic Functions
Algebra Textbooks Boundless Algebra Quadratic Functions and Factoring Applications of Quadratic Functions
Algebra Textbooks Boundless Algebra Quadratic Functions and Factoring
Algebra Textbooks Boundless Algebra
Algebra Textbooks
Algebra
Concept Version 9
Created by Boundless

Financial Applications of Quadratic Functions

For problems involving quadratics in finance, it is useful to graph the equation. From these, one can easily find critical values of the function by inspection.

Learning Objective

  • Apply the quadratic function to real world financial models


Key Points

    • In some financial math problems, several key points on a quadratic function are desired, so it can become tedious to calculate each algebraically.
    • Rather than calculating each key point of a function, one can find these values by inspection of its graph.
    • Graphs of quadratic functions can be used to find key points in many different relationships, from finance to science and beyond.

Full Text

The method of graphing a function to determine general properties can be used to solve financial problems.Given the algebraic equation for a quadratic function, one can calculate any point on the function, including critical values like minimum/maximum and x- and y-intercepts.

These calculations can be more tedious than is necessary, however. A graph contains all the above critical points and more, and acts as a clear and concise representation of a function. If one needs to determine several values on a quadratic function, glancing at a graph is quicker than calculating several points.

Example

Consider the function: 

F(x)=−x210+50x−750F(x)=-\frac {x^2}{10}+50x-750F(x)=−​10​​x​2​​​​+50x−750

Suppose this models a profit function f(x)f(x)f(x) in dollars that a company earns as a function of xxx number of products of a given type that are sold, and is valid for values of xxx greater than or equal to 000 and less than or equal to 500500500.

If a financier wanted to find the number of sales required to break even, the maximum possible loss (and the number of sales required for this loss), and the maximum profit (and the number of sales required for this profit), they could simply reference a graph instead of calculating it out algebraically.
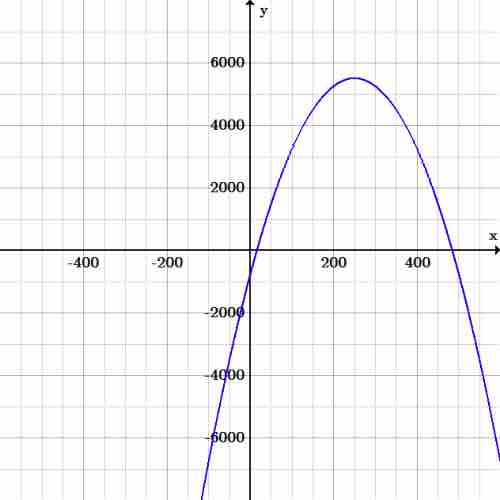
Financial example

Graph of the equation F(x)=−x210+50x−750F(x) = -\frac{x^2}{10} + 50x - 750F(x)=−​10​​x​2​​​​+50x−750, where the x-axis is number of sales, and the y-axis is the monetary return

By inspection, we can find that the maximum loss is $750 (the y-intercept), which is lost at both 000 and 500500500 sales. Maximum profit is $5500 (the vertex), which is achieved at 250250250 sales. The break-even points are between 151515 and 161616 sales, and between 484484484 and 485485485 sales.

[ edit ]
Edit this content
Prev Concept
Scientific Applications of Quadratic Functions
What Are Polynomials?
Next Concept
Subjects
  • Accounting
  • Algebra
  • Art History
  • Biology
  • Business
  • Calculus
  • Chemistry
  • Communications
  • Economics
  • Finance
  • Management
  • Marketing
  • Microbiology
  • Physics
  • Physiology
  • Political Science
  • Psychology
  • Sociology
  • Statistics
  • U.S. History
  • World History
  • Writing

Except where noted, content and user contributions on this site are licensed under CC BY-SA 4.0 with attribution required.