Algebra
Textbooks
Boundless Algebra
Introduction to Equations, Inequalities, and Graphing
Graphing and Equations of Two Variables
Algebra Textbooks Boundless Algebra Introduction to Equations, Inequalities, and Graphing Graphing and Equations of Two Variables
Algebra Textbooks Boundless Algebra Introduction to Equations, Inequalities, and Graphing
Algebra Textbooks Boundless Algebra
Algebra Textbooks
Algebra
Concept Version 12
Created by Boundless

Graphs of Equations as Graphs of Solutions

A solution to an equation can be plotted on graphs to better visualize how the equation, or function, behaves.

Learning Objective

  • Construct the graph of an equation by finding and plotting ordered-pair solutions


Key Points

    • To solve an equation is to find what values (numbers, functions, sets, etc.) fulfill a condition stated in the form of an equation.
    • Once an equation has been graphed, solutions to any particular $x$ or $y$ value can be readily found by simply looking at the graph.
    • To solve for a variable of an equation, you must use algebraic manipulations to get the variable by itself on one side of the equation (typically the left).

Terms

  • expression

    An arrangement of symbols denoting values, operations performed on them, and grouping symbols (e.g., $(2x+4)$).

  • equation

    An assertion that two expressions are equivalent (e.g., $x=5$).

  • graph

    A diagram displaying data, generally representing the relationship between two or more quantities.


Full Text

In mathematics, to solve an equation is to find what values (numbers, functions, sets, etc.) fulfill a condition stated in the form of an equation (two expressions related by equality). Each of the expressions contain one or more unknowns.

What is the graphical difference between equations with one variable and equations with two variables?

Graphs of Linear Equations with One Variable

A linear equation in one variable can be written in the form $ax+b=0, $ where $a$ and $b$ are real numbers and $a\neq 0$. In an equation where $x$ is a real number, the graph is the collection of all ordered pairs with any value of $y$ paired with that real number for $x$. 

For example, to graph the equation $x-1=0, $ a few of the ordered pairs would include:

  • $(1,-3)$
  • $(1,-2)$
  • $(1,-1)$
  • $(1,0)$
  • $(1,1)$
  • $(1,2)$
  • $(1,3)$

These can also be found by solving the equation of the graph for $x$, which yields $ x = 1$. This means that the $y$-values of the points don't matter as long as their $x$-values are 1. The graph is therefore a vertical line through those points, since all points have the same $x$-value.

The same is true for an equation written as $ay+b=0$, or $y=-4$, for example. The graph would be a horizontal line through points that all have $y$-values of -4. 

Therefore, when the equation is $y=C, $ where $C$ is a constant real number, the graph is a horizontal line. Similarly, if the equation is $x=C,$ then the graph is a vertical line.

Graphs of Equations with Two Variables

The graph of a cubic polynomial has an equation like $y=x^3-9x$.  Its equation has two variables, $x$ and $y$, and the equation is solved for $y$.

Plot specific points by substituting chosen $x$-values into the equation, and solve for the corresponding $y$ value, and then graph.

Let's choose values for $x$ from -2 to 2. When $x=-2$, we have: 

$y=(-2)^3-9(-2)=(-8)+18=10$

Therefore, $(-2,10)$ is a point on this curve (i.e., the graph of the equation).

After substituting the rest of the values, the following ordered pairs are found:

  • $(-1,8)$
  • $(0,0)$
  • $(1,-8)$
  • $(2,-10)$

After graphing the ordered pairs and connecting the points, we see that the set of (infinite) points follows this pattern:
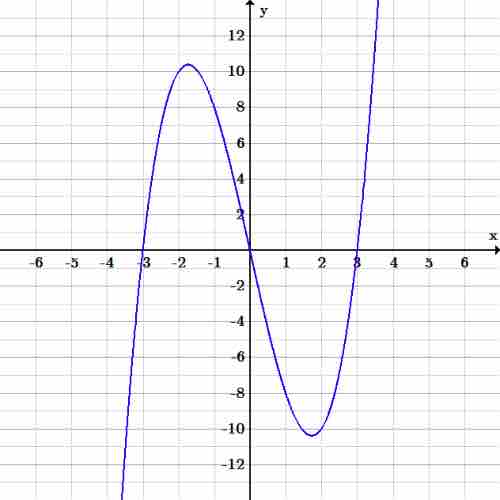
Graph of $y=x^3-9x$

Since the exponent of $x$ is a 3, it means that this equation is a 3rd-degree polynomial, called a cubic polynomial.

[ edit ]
Edit this content
Prev Concept
Graphing Equations
Graphing Inequalities
Next Concept
Subjects
  • Accounting
  • Algebra
  • Art History
  • Biology
  • Business
  • Calculus
  • Chemistry
  • Communications
  • Economics
  • Finance
  • Management
  • Marketing
  • Microbiology
  • Physics
  • Physiology
  • Political Science
  • Psychology
  • Sociology
  • Statistics
  • U.S. History
  • World History
  • Writing

Except where noted, content and user contributions on this site are licensed under CC BY-SA 4.0 with attribution required.