In our study of linear equations in two variables, we observed that all the solutions to an equation—and only those solutions— were located on the graph of that equation. We now wish to determine the location of the solutions to linear inequalities in two variables.
Linear inequalities in two variables have one of the following forms:
-
$ac + by < c$ -
$ac + by \leq c$ -
$ac + by > c$ -
$ac + by \geq c$
Recall that for a linear equation in two variables, ordered pairs that produce true statements when substituted into the equation are called "solutions" to that equation.
We can make a similar statement regarding inequalities in two variables. We say that an inequality in two variables has a solution when a pair of values has been found such that substituting these values into the inequality results in a true statement.
As with equations, solutions to linear inequalities have particular locations in the coordinate plane. For a linear equality in two variables, all solutions are located in one entire half-plane. A straight line drawn through the plane divides the plane into two half-planes, as shown in the diagram below. The straight line shown is called a boundary line.

Half-planes
The boundary line shown above divides the coordinate plane into two half-planes.
For example, consider the following inequality:
The graph below demonstrates all solutions to this inequality, which fall on the boundary line and in the shaded half-plane.
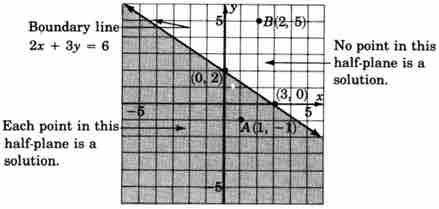
Graph of $2x + 3y \leq 6$
All points lying on the boundary line and in the shaded half-plane are solutions to this inequality.
Now consider the following inequality:
The graph below shows the solutions to this inequality: the shaded area above the boundary line. Note that because the inequality uses the
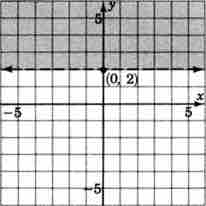
Graph of $y > 2$
All points in the shaded half-plane above the line are solutions to this inequality.
The method of graphing linear inequalities in two variables is as follows.
First, consider the inequality as an equation (i.e., replace the inequality sign with an equals sign) and graph that equation. This is called the boundary line. Note:
- If the inequality is
$\leq$ or$\geq$ , draw the boundary line solid. This means that points on the line are solutions and are part of the graph. - If the inequality is
$<$ or$>$ , draw the boundary line dotted. This means that points on the line are not solutions and are not part of the graph.
Determine which half-plane to shade by choosing a test point.
- If, when substituted, the test point yields a true statement, shade the half-plane containing it.
- If, when substituted, the test point yields a false statement, shade the half-plane on the opposite side of the boundary line.
Example 1
Graph the following inequality:
First, we need to graph the boundary line. To do so, consider the inequality as an equation:
Recall that, in order to graph an equation, we can substitute a value for one variable and solve for the other. The resulting ordered pair will be one solution to the equation. So, let's substitute
Now let's substitute
Now we can graph the two known solutions,
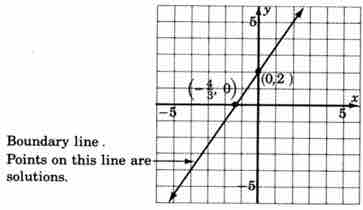
Graph of boundary line for $3x - 2y \geq -4$
Graph of the boundary line, drawn using two ordered-pair solutions.
Next, choose a test point to figure out which half-plane we need to shade in. The easiest test point is
This a true statement, so shade in the half-plane containing
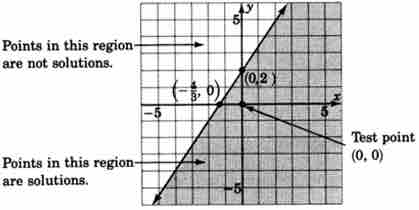
Graph of $3x - 2y \geq -4$
Graph showing all possible solutions of the given inequality. The solutions lie in the shaded region, including the boundary line.