Algebra
Textbooks
Boundless Algebra
Exponents, Logarithms, and Inverse Functions
Applications of Exponential and Logarithmic Functions
Algebra Textbooks Boundless Algebra Exponents, Logarithms, and Inverse Functions Applications of Exponential and Logarithmic Functions
Algebra Textbooks Boundless Algebra Exponents, Logarithms, and Inverse Functions
Algebra Textbooks Boundless Algebra
Algebra Textbooks
Algebra
Concept Version 11
Created by Boundless

Population Growth

Population can fluctuate positively or negatively and can be modeled using an exponential function. 

Learning Objective

  • Model population growth using exponential functions, explaining the relevant factors


Key Points

    • The formula for population growth is $P(r,t,f)=P{_i}(1+r)^{\frac{t}{f}}$ where $P{_i}$  represents initial population, $r$ is the rate of population growth (expressed as a decimal), $t$ is elapsed time, and $f$ is the period over which time population grows by a rate of $r$.
    • Population growth is dependent on four variables: Births ($B$ ), deaths ($D$), immigrants ($I$), and emigrants ($E$ ). Using these we model population growth as ${\Delta}P=(B-D)+(I-E)$  where  ${\Delta}P$ is the change in population.
    • Population growth rate can reveal whether a population size is increasing (positive) or decreasing (negative). It can be calculated for two distinct times with the following equation: $PGR=\frac{ln(P(t_2))-ln(P(t_1))}{(t_2-t_1)}$ where $t{_2}$ and $t{_1}$ are the two distinct times.

Terms

  • exponential

    Any function that has an exponent as an independent variable.

  • emigrant

    Someone who leaves a country to settle in a new country.

  • immigrant

    A person who comes to a country from another country in order to permanently settle in the new country.


Full Text

Introduction

Population growth can be modeled by an exponential equation. Namely, it is given by the formula $P(r, t, f)=P_i(1+r)^\frac{t}{f}$ where $P{_i}$ represents the initial population, r is the rate of population growth (expressed as a decimal), t is elapsed time, and f is the period over which time population grows by a rate of r. The ratio of t to f is often simplified into one value representing the number of compounding cycles.

The rate $r$ by which the population is growing is itself a function of four variables. These are births ($B$ ), deaths ($D$), immigrants ($I$) and emigrants ($E$). Specifically, the rate is given by:

${\Delta}P=(B-D)+(I-E)$ 

${\Delta}P$ denotes the change in population. The formula is split into natural growth which accounts for births and deaths ($B-D$) and mechanical growth which accounts for people moving into and out of a particular region ($I-E$).

Population Growth Rate

The population size can fluctuate from growth to decline, and back again. As such, another variable is important when studying population demographics and dynamics. It is the Population Growth Rate ($PGR$).

$PGR$ is the rate of change in population over a certain span of time: $t_2-t_1$. It can be determined using the formula:

 $\displaystyle PGR=\frac{ln(P(t_2))-ln(P(t_1))}{(t_2-t_1)}$

If we multiply the $PGR$ by $100$ we arrive at the percentage growth relative to the population at the beginning of the time period. 

A positive growth rate indicates an increasing population size, while a negative growth rate is characteristic of a decreasing population. A growth rate of $0$ means stagnation in population size.

World Population

In demographics, the world population is the total number of humans currently living. As of March 2016, it was estimated at 7.4 billion, an all-time high. The United Nations estimates it will further increase to 11.2 billion in the year 2100. If the current rates of births and deaths hold, the world population growth can be modeled using an exponential function. The graph below shows an exponential model for the growth of the world population. 

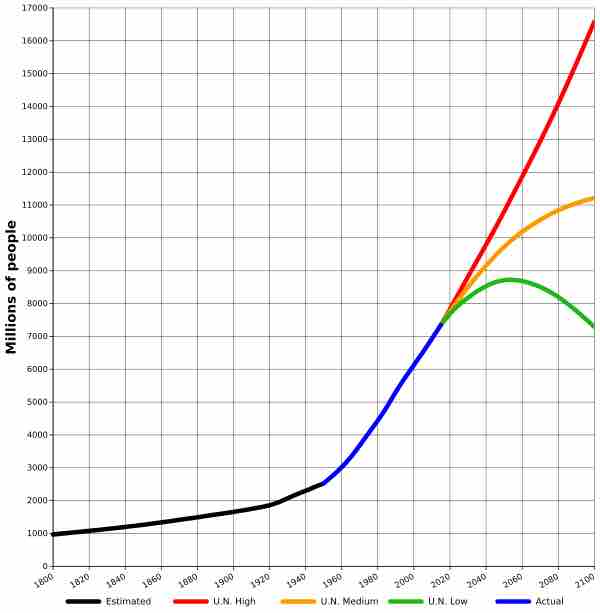
World-Population from 1800 (actual) to 2100 (projected)

The projected world population growths after the present day must be projected. A high estimation predicts the graph to continue at an increasing rate, a medium estimation predicts the population to level off, and a low estimation predicts the population to decline. 

The graph has the general shape of an exponential curve though it is not exact as is the case usually when we deal with real data as opposed to purely mathematical constructs. The data is at times estimated, at times actual and at times projected. Projections for high (red), medium (orange) and low (green) rates of change are represented accounting for the splitting off of the curve after 2016.

[ edit ]
Edit this content
Prev Concept
Natural Logarithms
Limited Growth
Next Concept
Subjects
  • Accounting
  • Algebra
  • Art History
  • Biology
  • Business
  • Calculus
  • Chemistry
  • Communications
  • Economics
  • Finance
  • Management
  • Marketing
  • Microbiology
  • Physics
  • Physiology
  • Political Science
  • Psychology
  • Sociology
  • Statistics
  • U.S. History
  • World History
  • Writing

Except where noted, content and user contributions on this site are licensed under CC BY-SA 4.0 with attribution required.