PowerPoint 2007
Working with Charts
Formatting charts
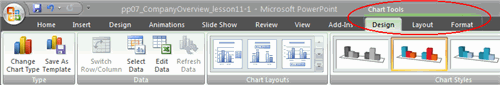
When you insert a chart, three new tabs will appear on the Ribbon. The three tabs—Design, Layout, and Format—contain various chart tools and commands that allow you to modify and format the chart.
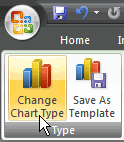
To change the chart type:
- Select the chart.
- Select the Design tab.
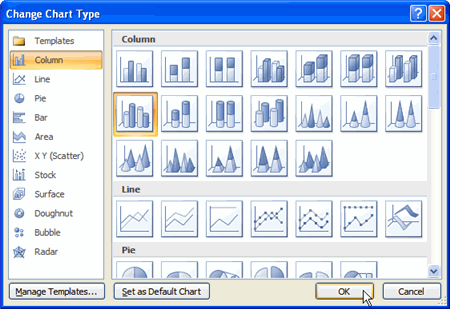
- Click the Change Chart Type command. The Insert Chart dialog box will appear.
- Select the chart you would like.
- Click OK. The chart will change on the slide to the new chart type.
To edit source data:
- Select the chart.
- Select the Design tab.
- Click the Edit Data command. An Excel spreadsheet with the current source data will appear.
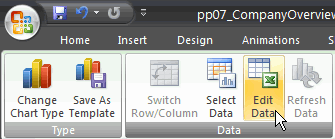
- Edit the data in the spreadsheet. The changes will appear on the slide.
- Close Excel without saving the spreadsheet.
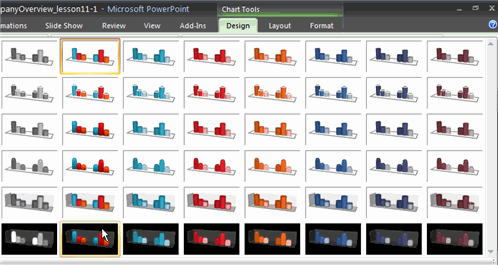
To change the chart style:
- Select the chart.
- Select the Design tab.
- Scroll through the options in the Chart Style group, or click the More drop-down arrow to see all available chart style options.
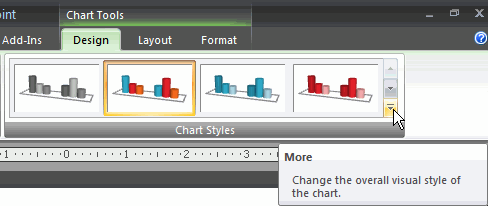
- Click a chart style to select it. The chart style will change on the slide.