PowerPoint 2003
Adding Charts, Diagrams, and Tables
Inserting a table
PowerPoint also gives you the option of displaying information within your presentation in a table.
To insert a table:
- Insert a new slide with a table icon.
- Click the Insert Table icon.

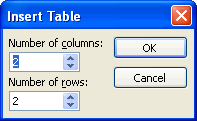
- When the dialog box appears, set the number of columns and rows for your table.

- Click OK.
- Enter the data for your table.
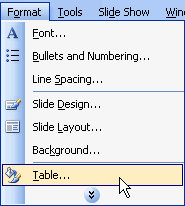
- To format the table, choose Format
 Table.

- Click the tabs and make any necessary changes.
- Click OK.


