Excel 2000
Editing Charts
Changing the Color of a Data Series
You can apply formatting to each data series of a chart. Although you can change different aspects of each data series, you will probably find that you change the color of bars, columns, pie slices and areas most often.
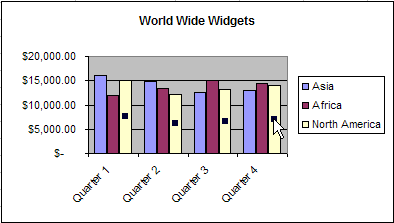
To change the color of a data series:
- Select the data series that you wish to edit.

- Click the Format Button
 on the Chart Toolbar (or double click the data series).
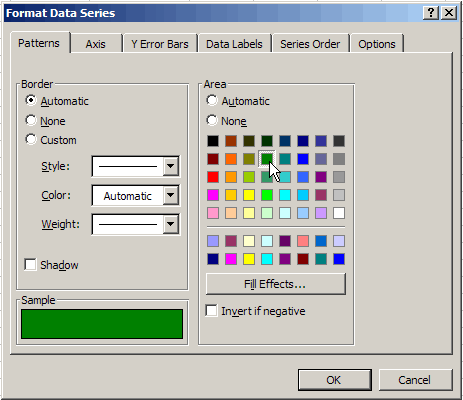
 - Use the Format Data Series dialog box to pick a new color.

- Click OK
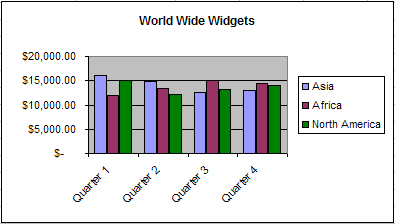
Your chart should display the new colors:


