Statistics
Textbooks
Boundless Statistics
Visualizing Data
Graphing Data
Statistics Textbooks Boundless Statistics Visualizing Data Graphing Data
Statistics Textbooks Boundless Statistics Visualizing Data
Statistics Textbooks Boundless Statistics
Statistics Textbooks
Statistics
Concept Version 6
Created by Boundless

Statistical Graphics

Statistical graphics allow results to be displayed in some sort of pictorial form and include scatter plots, histograms, and box plots.

Learning Objective

  • Recognize the techniques used in exploratory data analysis


Key Points

    • Graphical statistical methods explore the content of a data set.
    • Graphical statistical methods are used to find structure in data.
    • Graphical statistical methods check assumptions in statistical models.
    • Graphical statistical methods communicate the results of an analysis.
    • Graphical statistical methods communicate the results of an analysis.

Terms

  • histogram

    a representation of tabulated frequencies, shown as adjacent rectangles, erected over discrete intervals (bins), with an area equal to the frequency of the observations in the interval

  • scatter plot

    A type of display using Cartesian coordinates to display values for two variables for a set of data.

  • box plot

    A graphical summary of a numerical data sample through five statistics: median, lower quartile, upper quartile, and some indication of more extreme upper and lower values.


Full Text

Statistical graphics are used to visualize quantitative data. Whereas statistics and data analysis procedures generally yield their output in numeric or tabular form, graphical techniques allow such results to be displayed in some sort of pictorial form. They include plots such as scatter plots , histograms, probability plots, residual plots, box plots, block plots and bi-plots.

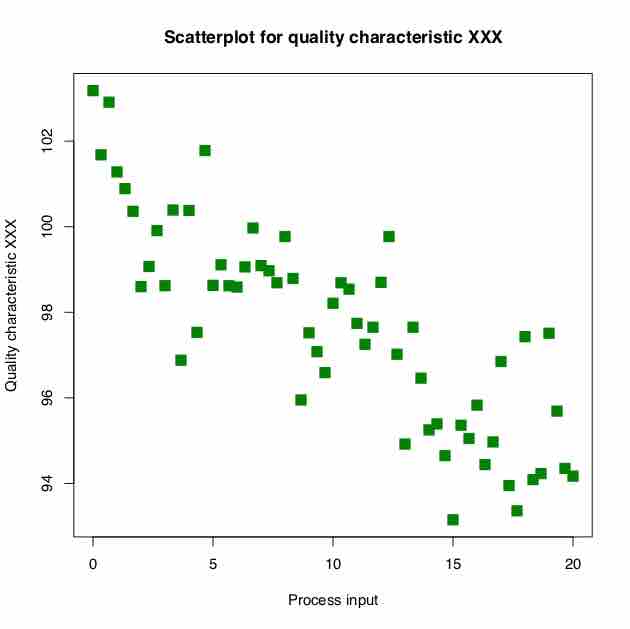
An example of a scatter plot

A scatter plot helps identify the type of relationship (if any) between two variables.

Exploratory data analysis (EDA) relies heavily on such techniques. They can also provide insight into a data set to help with testing assumptions, model selection and regression model validation, estimator selection, relationship identification, factor effect determination, and outlier detection. In addition, the choice of appropriate statistical graphics can provide a convincing means of communicating the underlying message that is present in the data to others.

Graphical statistical methods have four objectives:

• The exploration of the content of a data set

• The use to find structure in data

• Checking assumptions in statistical models

• Communicate the results of an analysis.

If one is not using statistical graphics, then one is forfeiting insight into one or more aspects of the underlying structure of the data.

Statistical graphics have been central to the development of science and date to the earliest attempts to analyse data. Many familiar forms, including bivariate plots, statistical maps, bar charts, and coordinate paper were used in the 18th century. Statistical graphics developed through attention to four problems:

• Spatial organization in the 17th and 18th century

• Discrete comparison in the 18th and early 19th century

• Continuous distribution in the 19th century and

• Multivariate distribution and correlation in the late 19th and 20th century.

Since the 1970s statistical graphics have been re-emerging as an important analytic tool with the revitalisation of computer graphics and related technologies.

[ edit ]
Edit this content
Prev Concept
Selective Breeding
Stem-and-Leaf Displays
Next Concept
Subjects
  • Accounting
  • Algebra
  • Art History
  • Biology
  • Business
  • Calculus
  • Chemistry
  • Communications
  • Economics
  • Finance
  • Management
  • Marketing
  • Microbiology
  • Physics
  • Physiology
  • Political Science
  • Psychology
  • Sociology
  • Statistics
  • U.S. History
  • World History
  • Writing

Except where noted, content and user contributions on this site are licensed under CC BY-SA 4.0 with attribution required.