Statistics
Textbooks
Boundless Statistics
Visualizing Data
Graphing Data
Statistics Textbooks Boundless Statistics Visualizing Data Graphing Data
Statistics Textbooks Boundless Statistics Visualizing Data
Statistics Textbooks Boundless Statistics
Statistics Textbooks
Statistics
Concept Version 9
Created by Boundless

Slope and Intercept

The concepts of slope and intercept are essential to understand in the context of graphing data.

Learning Objective

  • Explain the term rise over run when describing slope


Key Points

    • The slope or gradient of a line describes its steepness, incline, or grade -- with a higher slope value indicating a steeper incline.
    • The slope of a line in the plane containing the xxx and yyy axes is generally represented by the letter mmm, and is defined as the change in the yyy coordinate divided by the corresponding change in the xxx coordinate, between two distinct points on the line.
    • Using the common convention that the horizontal axis represents a variable xxx and the vertical axis represents a variable yyy, a yyy-intercept is a point where the graph of a function or relation intersects with the yyy-axis of the coordinate system.
    • Analogously, an xxx-intercept is a point where the graph of a function or relation intersects with the xxx-axis.

Terms

  • intercept

    the coordinate of the point at which a curve intersects an axis

  • slope

    the ratio of the vertical and horizontal distances between two points on a line; zero if the line is horizontal, undefined if it is vertical.


Full Text

Slope

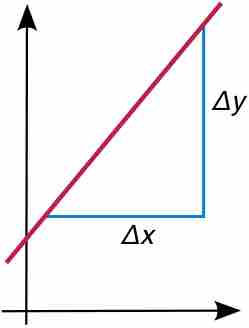
The slope or gradient of a line describes its steepness, incline, or grade. A higher slope value indicates a steeper incline. Slope is normally described by the ratio of the "rise" divided by the "run" between two points on a line. The line may be practical (as for a roadway) or in a diagram.

Slope

The slope of a line in the plane is defined as the rise over the run, m=ΔyΔxm = \frac{\Delta y}{\Delta x}m=​Δx​​Δy​​.

The slope of a line in the plane containing the x and y axes is generally represented by the letter m, and is defined as the change in the y coordinate divided by the corresponding change in the x coordinate, between two distinct points on the line. This is described by the following equation:

m=ΔyΔx=riserun\displaystyle m=\frac { \Delta y }{ \Delta x } =\frac { \text{rise} }{ \text{run} }m=​Δx​​Δy​​=​run​​rise​​

The Greek letter delta,
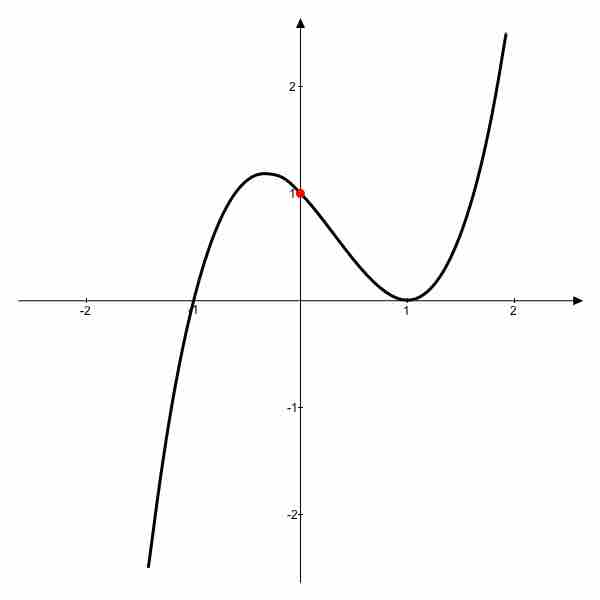
 Δ\DeltaΔ, is commonly used in mathematics to mean "difference" or "change". Given two points (x1,y1)(x_1, y_1)(x​1​​,y​1​​) and (x2,y2)(x_2, y_2)(x​2​​,y​2​​), the change in xxx from one to the other is x2−x1x_2-x_1x​2​​−x​1​​ (run), while the change in yyy is y2−y1y_2-y_1y​2​​−y​1​​ (rise).

Intercept

Using the common convention that the horizontal axis represents a variable xxx and the vertical axis represents a variable yyy, a yyy-intercept is a point where the graph of a function or relation intersects with the yyy-axis of the coordinate system. It also acts as a reference point for slopes and some graphs.

Intercept

Graph with a yyy-intercept at (0,1)(0, 1)(0,1).

If the curve in question is given as y=f(x)y=f(x)y=f(x), the yyy-coordinate of the yyy-intercept is found by calculating f(0)f(0)f(0). Functions which are undefined at x=0x=0x=0 have no yyy-intercept.

Some 2-dimensional mathematical relationships such as circles, ellipses, and hyperbolas can have more than one yyy-intercept. Because functions associate xxx values to no more than one yyy value as part of their definition, they can have at most one yyy-intercept.

Analogously, an xxx-intercept is a point where the graph of a function or relation intersects with the xxx-axis. As such, these points satisfy y=0y=0y=0. The zeros, or roots, of such a function or relation are the xxx-coordinates of these xxx-intercepts.

[ edit ]
Edit this content
Prev Concept
Plotting Points on a Graph
Plotting Lines
Next Concept
Subjects
  • Accounting
  • Algebra
  • Art History
  • Biology
  • Business
  • Calculus
  • Chemistry
  • Communications
  • Economics
  • Finance
  • Management
  • Marketing
  • Microbiology
  • Physics
  • Physiology
  • Political Science
  • Psychology
  • Sociology
  • Statistics
  • U.S. History
  • World History
  • Writing

Except where noted, content and user contributions on this site are licensed under CC BY-SA 4.0 with attribution required.