Statistics
Textbooks
Boundless Statistics
Measures of Variation
Describing Variability
Statistics Textbooks Boundless Statistics Measures of Variation Describing Variability
Statistics Textbooks Boundless Statistics Measures of Variation
Statistics Textbooks Boundless Statistics
Statistics Textbooks
Statistics
Concept Version 10
Created by Boundless

Variance

Variance is the sum of the probabilities that various outcomes will occur multiplied by the squared deviations from the average of the random variable.

Learning Objective

  • Calculate variance to describe a population


Key Points

    • When determining the "spread" of the population, we want to know a measure of the possible distances between the data and the population mean.
    • When trying to determine the risk associated with a given set of options, the variance is a very useful tool.
    • When dealing with the complete population the (population) variance is a constant, a parameter which helps to describe the population.
    • When dealing with a sample from the population the (sample) variance is actually a random variable, whose value differs from sample to sample.

Terms

  • deviation

    For interval variables and ratio variables, a measure of difference between the observed value and the mean.

  • spread

    A numerical difference.


Full Text

When describing data, it is helpful (and in some cases necessary) to determine the spread of a distribution. In describing a complete population, the data represents all the elements of the population. When determining the spread of the population, we want to know a measure of the possible distances between the data and the population mean. These distances are known as deviations.

The variance of a data set measures the average square of these deviations. More specifically, the variance is the sum of the probabilities that various outcomes will occur multiplied by the squared deviations from the average of the random variable. When trying to determine the risk associated with a given set of options, the variance is a very useful tool.

Calculating the Variance

Calculating the variance begins with finding the mean. Once the mean is known, the variance is calculated by finding the average squared deviation of each number in the sample from the mean. For the numbers 1, 2, 3, 4, and 5, the mean is 3. The calculation for finding the mean is as follows:

$\displaystyle \frac{1+2+3+4+5}{5} = \frac{15}{5} = 3$

Once the mean is known, the variance can be calculated. The variance for the above set of numbers is:

$\displaystyle \sigma^2 = \frac{(1-3)^2 + (2-3)^2 + (3-3)^2 + (4-3)^2 + (5-3)^2}{5}$ 

$\displaystyle \sigma^2 = \frac{(-2)^2 + (-1)^2 + (0)^2 + (1)^2 + (2)^2}{5}$

$\displaystyle \sigma^2 = \frac{4+1+0+1+4}{5}$

$\displaystyle \sigma^2 = \frac{10}{5} = 2$

A clear distinction should be made between dealing with the population or with a sample from it. When dealing with the complete population the (population) variance is a constant, a parameter which helps to describe the population. When dealing with a sample from the population the (sample) variance is actually a random variable, whose value differs from sample to sample.

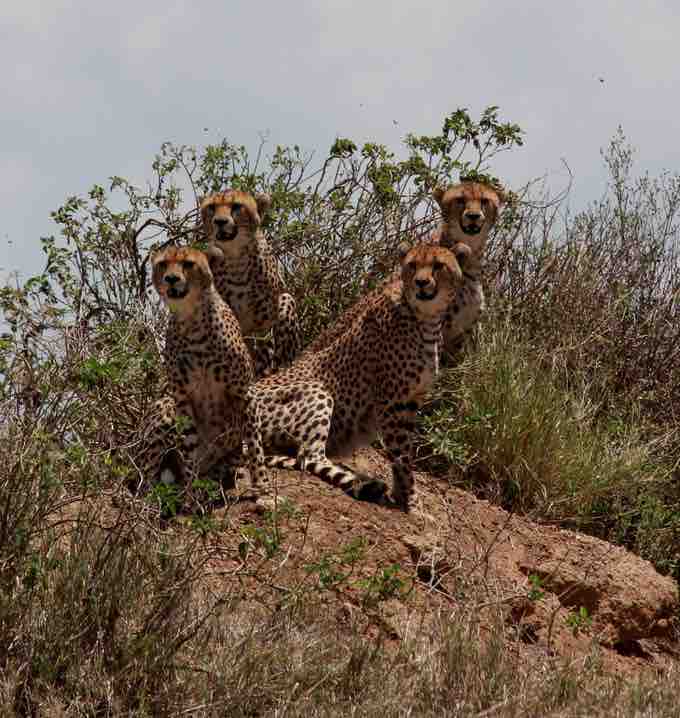
Population of Cheetahs

The population variance can be very helpful in analyzing data of various wildlife populations.

[ edit ]
Edit this content
Prev Concept
Range
Standard Deviation: Definition and Calculation
Next Concept
Subjects
  • Accounting
  • Algebra
  • Art History
  • Biology
  • Business
  • Calculus
  • Chemistry
  • Communications
  • Economics
  • Finance
  • Management
  • Marketing
  • Microbiology
  • Physics
  • Physiology
  • Political Science
  • Psychology
  • Sociology
  • Statistics
  • U.S. History
  • World History
  • Writing

Except where noted, content and user contributions on this site are licensed under CC BY-SA 4.0 with attribution required.