Statistics
Textbooks
Boundless Statistics
Describing, Exploring, and Comparing Data
Further Considerations for Data
Statistics Textbooks Boundless Statistics Describing, Exploring, and Comparing Data Further Considerations for Data
Statistics Textbooks Boundless Statistics Describing, Exploring, and Comparing Data
Statistics Textbooks Boundless Statistics
Statistics Textbooks
Statistics
Concept Version 4
Created by Boundless

Odds Ratios

The odds of an outcome is the ratio of the expected number of times the event will occur to the expected number of times the event will not occur.

Learning Objective

  • Define the odds ratio and demonstrate its computation.


Key Points

    • The odds ratio is one way to quantify how strongly having or not having the property $A$ is associated with having or not having the property $B$ in a population.
    • The odds ratio is a measure of effect size, describing the strength of association or non-independence between two binary data values.
    • To compute the odds ratio, we 1) compute the odds that an individual in the population has $A$ given that he or she has $B$, 2) compute the odds that an individual in the population has $A$ given that he or she does not have $B$ and 3) divide the first odds by the second odds.
    • If the odds ratio is greater than one, then having $A$ is associated with having $B$ in the sense that having $B$ raises the odds of having $A$.

Terms

  • logarithm

    for a number $x$, the power to which a given base number must be raised in order to obtain $x$

  • odds

    the ratio of the probabilities of an event happening to that of it not happening


Full Text

The odds of an outcome is the ratio of the expected number of times the event will occur to the expected number of times the event will not occur. Put simply, the odds are the ratio of the probability of an event occurring to the probability of no event.

An odds ratio is the ratio of two odds. Imagine each individual in a population either does or does not have a property $A$, and also either does or does not have a property $B$. For example, $A$ might be "has high blood pressure," and $B$ might be "drinks more than one alcoholic drink a day." The odds ratio is one way to quantify how strongly having or not having the property $A$ is associated with having or not having the property $B$ in a population. In order to compute the odds ratio, one follows three steps:

  1. Compute the odds that an individual in the population has $A$given that he or she has $B$ (probability of $A$ given $B$ divided by the probability of not-$A$ given $B$).
  2. Compute the odds that an individual in the population has $A$ given that he or she does not have $B$.
  3. Divide the first odds by the second odds to obtain the odds ratio.

If the odds ratio is greater than one, then having $A$ is associated with having $B$ in the sense that having $B$ raises (relative to not having $B$) the odds of having $A$. Note that this is not enough to establish that $B$ is a contributing cause of $A$. It could be that the association is due to a third property, $C$, which is a contributing cause of both $A$ and $B$.

In more technical language, the odds ratio is a measure of effect size, describing the strength of association or non-independence between two binary data values. It is used as a descriptive statistic and plays an important role in logistic regression.

Example

Suppose that in a sample of $100$ men $90$ drank wine in the previous week, while in a sample of $100$ women only $20$ drank wine in the same period. The odds of a man drinking wine are $90$ to $10$ (or $9:1$) while the odds of a woman drinking wine are only $20$ to $80$ (or $1:4=0.25:1$). The odds ratio is thus $\frac{9}{0.25}$ (or $36$) showing that men are much more likely to drink wine than women. The detailed calculation is:

$\dfrac { 0.9/0.1 }{ 0.2/0.8 } =\dfrac { 0.9\cdot 0.8 }{ 0.1\cdot 0.2 } =\dfrac { 0.72 }{ 0.02 } =36$

This example also shows how odds ratios are sometimes sensitive in stating relative positions. In this sample men are
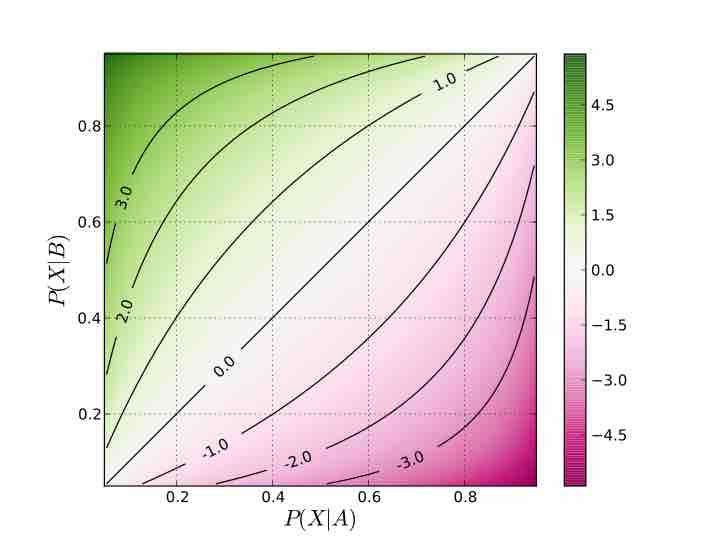
 $\frac{90}{20} = 4.5$ times more likely to have drunk wine than women, but have $36$ times the odds. The logarithm of the odds ratio—the difference of the logits of the probabilities—tempers this effect and also makes the measure symmetric with respect to the ordering of groups. For example, using natural logarithms, an odds ratio of $\frac{36}{1}$ maps to $3.584$, and an odds ratio of $\frac{1}{36}$ maps to $−3.584$.

Odds Ratios

A graph showing how the log odds ratio relates to the underlying probabilities of the outcome $X$ occurring in two groups, denoted $A$ and $B$. The log odds ratio shown here is based on the odds for the event occurring in group $B$ relative to the odds for the event occurring in group $A$. Thus, when the probability of $X$ occurring in group $B$ is greater than the probability of $X$ occurring in group $A$, the odds ratio is greater than $1$, and the log odds ratio is greater than $0$.

[ edit ]
Edit this content
Prev Concept
Comparing Two Sample Averages
When Does the Z-Test Apply?
Next Concept
Subjects
  • Accounting
  • Algebra
  • Art History
  • Biology
  • Business
  • Calculus
  • Chemistry
  • Communications
  • Economics
  • Finance
  • Management
  • Marketing
  • Microbiology
  • Physics
  • Physiology
  • Political Science
  • Psychology
  • Sociology
  • Statistics
  • U.S. History
  • World History
  • Writing

Except where noted, content and user contributions on this site are licensed under CC BY-SA 4.0 with attribution required.