Outliers
In statistics, an outlier is an observation that is numerically distant from the rest of the data. Outliers can occur by chance in any distribution, but they are often indicative either of measurement error or that the population has a heavy-tailed distribution. In the former case, one wishes to discard them or use statistics that are robust to outliers, while in the latter case, they indicate that the distribution is skewed and that one should be very cautious in using tools or intuitions that assume a normal distribution.
When looking at regression lines that show where the data points fall, outliers are far away from the best fit line. They have large "errors," where the "error" or residual is the vertical distance from the line to the point.
Outliers need to be examined closely. Sometimes, for some reason or another, they should not be included in the analysis of the data. It is possible that an outlier is a result of erroneous data. Other times, an outlier may hold valuable information about the population under study and should remain included in the data. The key is to carefully examine what causes a data point to be an outlier.
Identifying Outliers
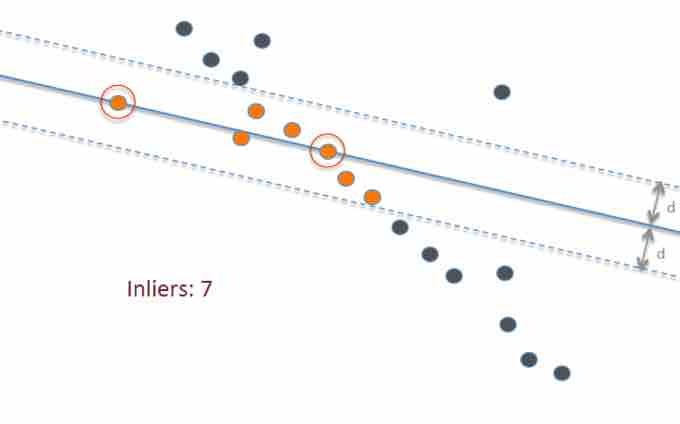
We could guess at outliers by looking at a graph of the scatterplot and best fit line. However, we would like some guideline as to how far away a point needs to be in order to be considered an outlier. As a rough rule of thumb, we can flag any point that is located further than two standard deviations above or below the best fit line as an outlier, as illustrated below. The standard deviation used is the standard deviation of the residuals or errors.
Statistical outliers
This graph shows a best-fit line (solid blue) to fit the data points, as well as two extra lines (dotted blue) that are two standard deviations above and below the best fit line. Highlighted in orange are all the points, sometimes called "inliers", that lie within this range; anything outside those lines—the dark-blue points—can be considered an outlier.
Note: There is no rigid mathematical definition of what constitutes an outlier; determining whether or not an observation is an outlier is ultimately a subjective exercise. The above rule is just one of many rules used. Another method often used is based on the interquartile range (IQR). For example, some people use the
If we are to use the standard deviation rule, we can do this visually in the scatterplot by drawing an extra pair of lines that are two standard deviations above and below the best fit line. Any data points that are outside this extra pair of lines are flagged as potential outliers. Or, we can do this numerically by calculating each residual and comparing it to twice the standard deviation. Graphing calculators make this process fairly simple.
Causes for Outliers
Outliers can have many anomalous causes. A physical apparatus for taking measurements may have suffered a transient malfunction. There may have been an error in data transmission or transcription. Outliers arise due to changes in system behavior, fraudulent behavior, human error, instrument error or simply through natural deviations in populations. A sample may have been contaminated with elements from outside the population being examined. Alternatively, an outlier could be the result of a flaw in the assumed theory, calling for further investigation by the researcher.
Unless it can be ascertained that the deviation is not significant, it is ill-advised to ignore the presence of outliers. Outliers that cannot be readily explained demand special attention.