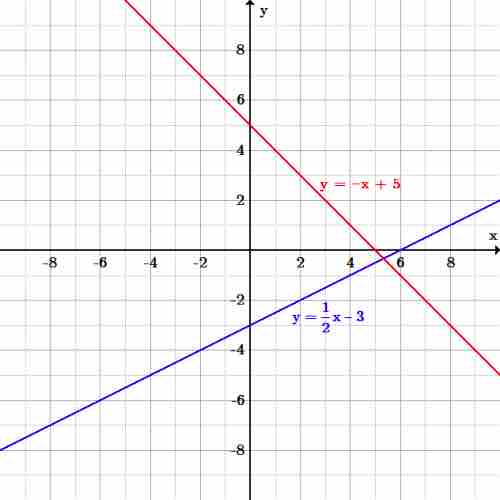
Graphs of linear functions
The blue line,
Source
Boundless vets and curates high-quality, openly licensed content from around the Internet. This particular resource used the following sources:
The blue line,
Boundless vets and curates high-quality, openly licensed content from around the Internet. This particular resource used the following sources: