Algebra
Textbooks
Boundless Algebra
Linear Functions
Introduction to Linear Functions
Algebra Textbooks Boundless Algebra Linear Functions Introduction to Linear Functions
Algebra Textbooks Boundless Algebra Linear Functions
Algebra Textbooks Boundless Algebra
Algebra Textbooks
Algebra
Concept Version 4
Created by Boundless

Direct and Inverse Variation

Two variables in direct variation have a linear relationship, while variables in inverse variation do not.

Learning Objective

  • Relate the concept of slope to the concepts of direct and inverse variation


Key Points

    • Two variables that change proportionally to one another are said to be in direct variation.
    • The relationship between two directly proportionate variable can be represented by a linear equation in slope-intercept form, and is easily modeled using a linear graph.
    • Inverse variation is the opposite of direct variation; two variables are said to be inversely proportional when a change is performed on one variable and the opposite happens to the other. 
    • The relationship between two inversely proportionate variables cannot be represented by a linear equation, and its graphical representation is not a line, but a hyperbola.

Terms

  • hyperbola

    A conic section formed by the intersection of a cone with a plane that intersects the base of the cone and is not tangent to the cone.

  • proportional

    At a constant ratio. Two magnitudes (numbers) are said to be proportional if the second varies in a direct relation arithmetically to the first.


Full Text

Direct Variation

Simply put, two variables are in direct variation when the same thing that happens to one variable happens to the other. If $x$ and $y$ are in direct variation, and $x$ is doubled, then $y$ would also be doubled. The two variables may be considered directly proportional.

For example, a toothbrush costs $2$ dollars. Purchasing $5$ toothbrushes would cost $10$ dollars, and purchasing $10$ toothbrushes would $20$ cost dollars. Thus we can say that the cost varies directly as the value of toothbrushes.

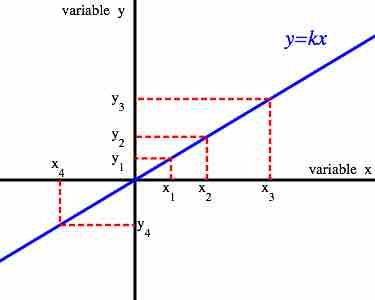
Direct variation is represented by a linear equation, and can be modeled by graphing a line. Since we know that the relationship between two values is constant, we can give their relationship with:

$\displaystyle \frac{y}{x} = k$

Where $k$ is a constant.

Rewriting this equation by multiplying both sides by $x$ yields:

$\displaystyle y = kx$

Notice that this is a linear equation in slope-intercept form, where the $y$-intercept $b$ is equal to $0$. 

Thus, any line passing through the origin represents a direct variation between $x$ and $y$:

Directly Proportional Variables

The graph of $y = kx$ demonstrates an example of direct variation between two variables.

Revisiting the example with toothbrushes and dollars, we can define the $x$-axis as number of toothbrushes and the $y$-axis as number of dollars. Doing so, the variables would abide by the relationship:

$\displaystyle \frac{y}{x} = 2$

Any augmentation of one variable would lead to an equal augmentation of the other. For example, doubling $y$ would result in the doubling of $x$.

Inverse Variation

Inverse variation is the opposite of direct variation. In the case of inverse variation, the increase of one variable leads to the decrease of another. In fact, two variables are said to be inversely proportional when an operation of change is performed on one variable and the opposite happens to the other. For example, if $x$ and $y$ are inversely proportional, if $x$ is doubled, then $y$ is halved.

As an example, the time taken for a journey is inversely proportional to the speed of travel. If your car travels at a greater speed, the journey to your destination will be shorter.

Knowing that the relationship between the two variables is constant, we can show that their relationship is:

$\displaystyle yx = k$

Where $k$ is a constant known as the constant of proportionality. Note that as long as $k$ is not equal to $0$, neither $x$ nor $y$ can ever equal $0$ either. We can rearrange the above equation to place the variables on opposite sides:

$\displaystyle y=\frac{k}{x}$

Notice that this is not a linear equation. It is impossible to put it in slope-intercept form. Thus, an inverse relationship cannot be represented by a line with constant slope. Inverse variation can be illustrated with a graph in the shape of a hyperbola, pictured below. 

Inversely Proportional Function

An inversely proportional relationship between two variables is represented graphically by a hyperbola.

[ edit ]
Edit this content
Prev Concept
Slope
Zeroes of Linear Functions
Next Concept
Subjects
  • Accounting
  • Algebra
  • Art History
  • Biology
  • Business
  • Calculus
  • Chemistry
  • Communications
  • Economics
  • Finance
  • Management
  • Marketing
  • Microbiology
  • Physics
  • Physiology
  • Political Science
  • Psychology
  • Sociology
  • Statistics
  • U.S. History
  • World History
  • Writing

Except where noted, content and user contributions on this site are licensed under CC BY-SA 4.0 with attribution required.