Algebra
Textbooks
Boundless Algebra
Introduction to Equations, Inequalities, and Graphing
Graphing and Equations of Two Variables
Algebra Textbooks Boundless Algebra Introduction to Equations, Inequalities, and Graphing Graphing and Equations of Two Variables
Algebra Textbooks Boundless Algebra Introduction to Equations, Inequalities, and Graphing
Algebra Textbooks Boundless Algebra
Algebra Textbooks
Algebra
Concept Version 11
Created by Boundless

Graphing Equations

Equations and their relationships can be visualized in many different types of graphs.

Learning Objective

  • Graph an equation in two variables in the Cartesian plane


Key Points

    • Graphs are important tools for visualizing equations.
    • To graph an equation, choose a value for either $x$ or $y$, solve for the variable you didn't choose, plot the ordered pair as a point on the Cartesian plane, and repeat, until you have enough points plotted that you can connect them to visualize the graph.

Terms

  • point

    An entity that has a location in space or on a plane, but has no extent.

  • graph

    A diagram displaying data; in particular, one showing the relationship between two or more quantities, measurements or numbers.


Full Text

Now that we know what equations are, how do we go about visualizing them? For an equation with two variables, $x$ and $y$, we need a graph with two axes: an $x$-axis and a $y$-axis. We will use the Cartesian plane, in which the $x$-axis is a horizontal line and the $y$-axis is a vertical line. Where the two axes cross is called the origin.

Graphing an Equation in Two Variables

Let's start with the following equation:

$y=2x-3$

We'll start by choosing a few $x$-values, plugging them into this equation, and solving for the unknown variable $y$. After creating a few $x$ and $y$ ordered pairs, we will plot them on the Cartesian plane and connect the points.

For the three values for $x$, let's choose a negative number, zero, and a positive number so we include points on both sides of the $y$-axis:

  • If $x=-2$, then $y=-7$. We plot the point $(-2,-7)$.
  • If $x=0$, then $y=-3$. We plot the point $(0,-3)$.
  • If $x=2$, then $y=1$. We plot the point $(2,1)$.

Now we can connect the dots to visualize the graph of the equation:
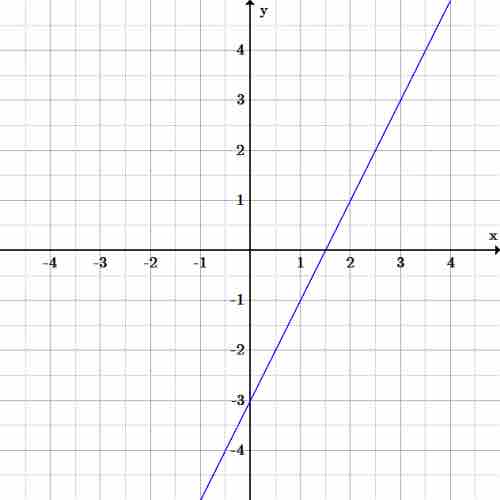
Graph of $y=2x-3$

The equation is the graph of a line through the three points found above. The line continues on to infinity in each direction, since there is an infinite series of ordered pairs of solutions.

Graphing Non-Linear Equations

Example 1

What graph will the following equation make?

$x^{2}+y^{2} = 100$

Let's figure it out by choosing some points to plot.

First, let's try $x=0$:

$\begin{aligned} (0)^{2}+y^{2} &= 100 \\ y^{2} &= 100 \\ \sqrt{y^{2}}&=\sqrt{100} \\ y &= \pm10 \end{aligned}$

So we plot $(0,10)$ and $(0,-10)$. 

Note that we don't always have to choose values for $x$. For example, let's now try setting $y=0$. 

Through the same arithmetic as above, we get the ordered pairs $(10,0)$ and $(-10,0)$. Plot these as well.

We still don't have enough points to really see what's going on, so let's choose some more. Let's try solving for $y$ when $x=6$:

$\begin{aligned} (6)^2+y^2&=100 \\ 36+y^2&=100 \\ 36+y^2-36&=100-36 \\ y^2&=64 \\ y&=\pm 8 \end{aligned}$

So that's two new points: $(6,8)$ and $(6,-8)$. We get similar results with $x=-6$, to get $(-6,8)$ and $(-6,-8)$.  

Now you can begin seeing that we're drawing a circle with a radius of 10:

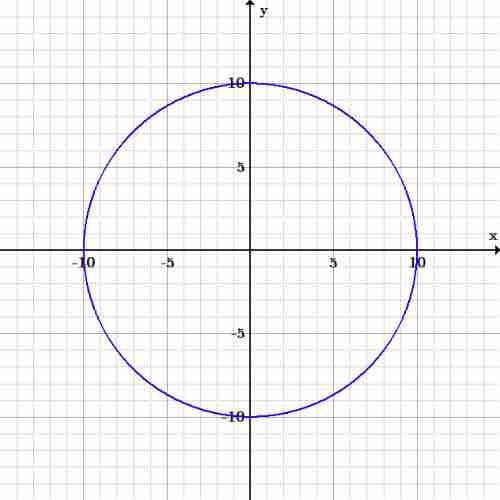
Graph of $x^2+y^2=100$

This is a graph of a circle with radius 10 and center at the origin.

Example 2

Let's try another example. This time let's use the following equation:

$ y=-x^{2}+9$

Again, let's plug in some numbers and begin plotting points.

Input values (for the independent variable
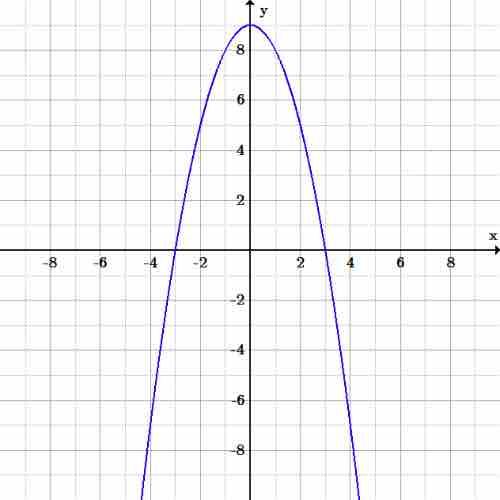
 $x$) from -2 to 2 can be used to obtain output values (the dependent variable $y$) from 5 to 9.  Connect these points with the best curve you can, and you'll discover you've drawn a parabola.

Graph of $y=-x^2+9$

This graph is of a parabola (a U-shaped open curve symmetric about a line). Parabolas can open up or down, right or left; they also have a maximum or minimum value.

[ edit ]
Edit this content
Prev Concept
Equations in Two Variables
Graphs of Equations as Graphs of Solutions
Next Concept
Subjects
  • Accounting
  • Algebra
  • Art History
  • Biology
  • Business
  • Calculus
  • Chemistry
  • Communications
  • Economics
  • Finance
  • Management
  • Marketing
  • Microbiology
  • Physics
  • Physiology
  • Political Science
  • Psychology
  • Sociology
  • Statistics
  • U.S. History
  • World History
  • Writing

Except where noted, content and user contributions on this site are licensed under CC BY-SA 4.0 with attribution required.