We will illustrate the concept of sampling distributions with a simple example. Consider three pool balls, each with a number on it. Two of the balls are selected randomly (with replacement), and the average of their numbers is computed. All possible outcomes are shown below.
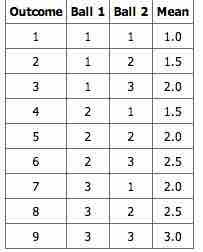
Pool Ball Example 1
This table shows all the possible outcome of selecting two pool balls randomly from a population of three.
Notice that all the means are either 1.0, 1.5, 2.0, 2.5, or 3.0. The frequencies of these means are shown below. The relative frequencies are equal to the frequencies divided by nine because there are nine possible outcomes.
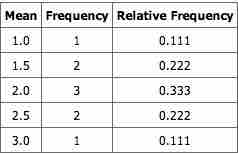
Pool Ball Example 2
This table shows the frequency of means for
The figure below shows a relative frequency distribution of the means. This distribution is also a probability distribution since the
Relative Frequency Distribution
Relative frequency distribution of our pool ball example.
The distribution shown in the above figure is called the sampling distribution of the mean. Specifically, it is the sampling distribution of the mean for a sample size of 2 (
There is an alternative way of conceptualizing a sampling distribution that will be useful for more complex distributions. Imagine that two balls are sampled (with replacement), and the mean of the two balls is computed and recorded. This process is repeated for a second sample, a third sample, and eventually thousands of samples. After thousands of samples are taken and the mean is computed for each, a relative frequency distribution is drawn. The more samples, the closer the relative frequency distribution will come to the sampling distribution shown in the above figure. As the number of samples approaches infinity , the frequency distribution will approach the sampling distribution. This means that you can conceive of a sampling distribution as being a frequency distribution based on a very large number of samples. To be strictly correct, the sampling distribution only equals the frequency distribution exactly when there is an infinite number of samples.